Under the Hood 9: eBPF Explained: How Programs Run Safely Inside the Linux Kernel
eBPF executes sandboxed bytecode inside the Linux kernel at native JIT speed without kernel modules. Verified for memory safety, it powers live Kubernetes observability, security, and networking (Cilium, bpftrace) letting SREs diagnose p99 latency spikes in seconds without restarts.
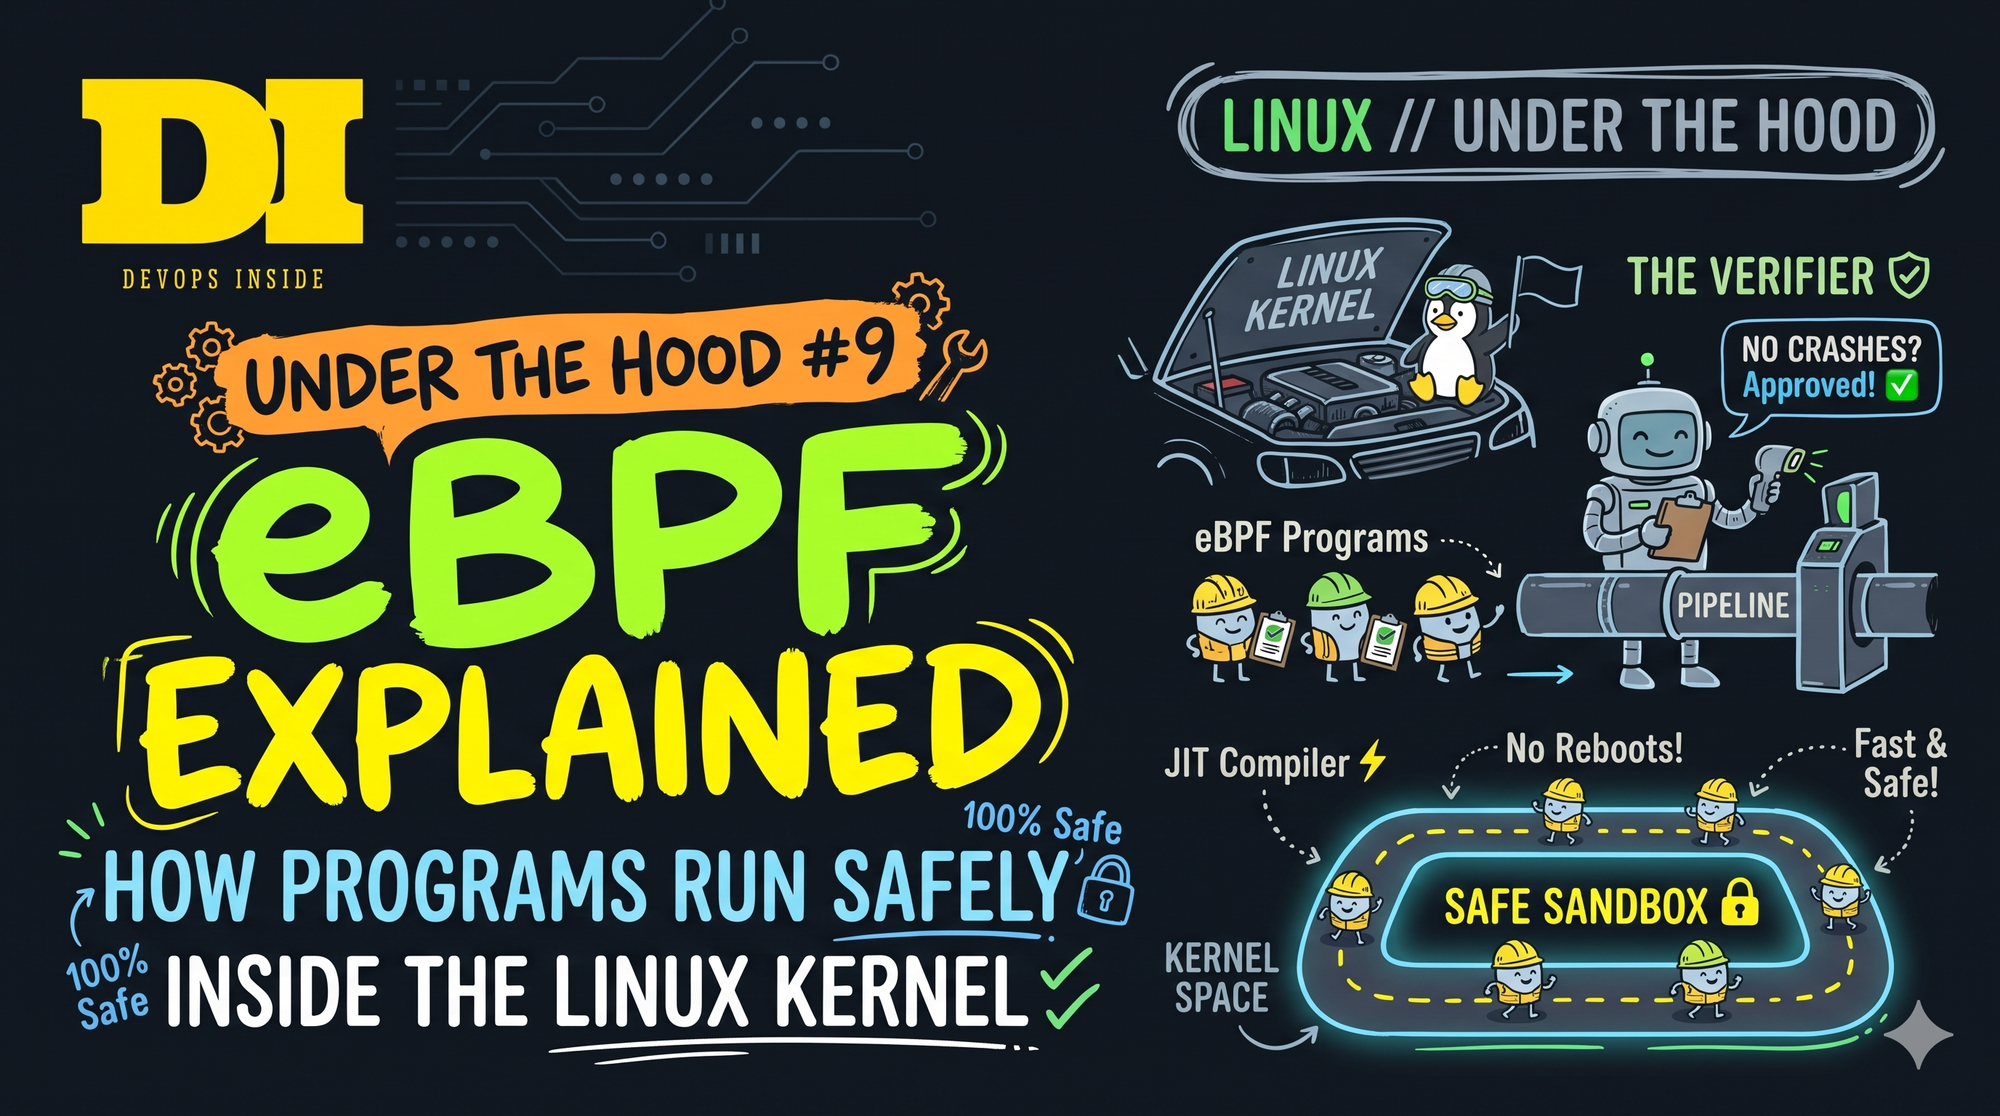
It's 3:40 PM on a Thursday. Checkout latency has jumped from 80 ms to 1.2 seconds at p99, but only on three of your twelve nodes. The application logs show nothing. Node CPU sits at 30%. Restarting the pods might make the graphs look better for a while, and it would destroy every piece of evidence.
A senior SRE SSHes into one of the bad nodes and types a single command:
sudo tcpretrans-bpfccThe terminal starts scrolling almost immediately:
Tracing retransmits ... Hit Ctrl-C to end
TIME     PID    IP LADDR:LPORT          T> RADDR:RPORT          STATE
15:40:12 0      4  10.20.3.17:41822     R> 10.20.9.41:5432      ESTABLISHED
15:40:12 0      4  10.20.3.17:41830     R> 10.20.9.41:5432      ESTABLISHED
15:40:13 0      4  10.20.3.17:41822     R> 10.20.9.41:5432      ESTABLISHED
15:40:13 0      4  10.20.3.17:41866     R> 10.20.9.41:5432      ESTABLISHED
Every retransmission is going to the same place: port 5432 on one database replica. The three slow nodes are the ones in the zone that reads from that replica. A vague application mystery has become a precise question for the network team, and ten minutes later the switch counters answer it: a flaky top-of-rack port in front of the replica, logging CRC errors and dropping packets.
Time from SSH to knowing exactly where to look: about thirty seconds.
Nobody deployed an agent, restarted a pod or loaded a kernel module. The BCC tools were already baked into the node image, so the SRE simply asked the running kernel a question and read the answer.
That tool, along with Cilium, Falco, Tetragon, Pixie, Grafana Beyla and most modern profilers, runs on the same technology: eBPF.
What is eBPF? The short answer
eBPF lets you run small, sandboxed programs inside the Linux kernel without writing a kernel module or rebooting. A program is compiled to eBPF bytecode, checked by the kernel's verifier so it cannot crash or hang the kernel, JIT-compiled to native code, and attached to a hook such as a system call, a kernel function or a network interface.
Each time the hook fires, the program runs and stores results in eBPF maps that user-space tools read. That is how Cilium load-balances Kubernetes Services without kube-proxy, how Falco sees every system call, and how bpftrace answers production questions in seconds.
What Is eBPF, Really?
The Linux kernel has always been the most privileged and least flexible part of your system. If you wanted new behavior inside it, you had two options: get a patch accepted upstream and wait years for it to reach your distribution, or write a kernel module. Modules run with full kernel privilege, so one bad pointer means a kernel panic and a dead node.
eBPF is a third option. It is a small virtual machine built into the kernel that runs programs you load at runtime, but only after the kernel has proven they are safe to run.
The name is historical. The original Berkeley Packet Filter, designed by Steven McCanne and Van Jacobson at Lawrence Berkeley Laboratory in 1992, was a tiny instruction set with one job: deciding which packets tcpdump should capture. In 2014, work led by Alexei Starovoitov rebuilt it as extended BPF, and Linux 3.18 added the bpf() system call that December. The new design brought 64-bit registers, many more instructions, persistent data structures called maps, and the ability to attach to far more than sockets.
Today "BPF" and "eBPF" mean the same thing. When the IETF standardized the instruction set as RFC 9669 in October 2024, it noted that eBPF is no longer an acronym for anything, which is fair: packet filtering is now a small part of the job. eBPF routes Kubernetes traffic, enforces security policy, profiles every process on a node and, since Linux 6.12, can even supply the CPU scheduling policy through sched_ext.
Brendan Gregg popularized a useful comparison: eBPF does to Linux what JavaScript does to HTML. The browser stays the same, but sandboxed scripts change what a page can do. The kernel stays the same too, while sandboxed programs change what it can observe and enforce. (Gregg's own version adds "sort of", and he's right to hedge. eBPF is far more restricted than JavaScript, for reasons the verifier section makes clear.)
The Life of an eBPF Program
Every eBPF program, whether it comes from a one-line bpftrace command or from Cilium's datapath, goes through the same pipeline:
  Write        C, Rust (Aya) or a bpftrace script
    │          user-space loaders: libbpf (C), cilium/ebpf (Go), Aya (Rust)
    ▼
  Compile      clang -O2 -g -target bpf  ──►  eBPF bytecode in an ELF .o file
    │          (-g emits the BTF type info CO-RE needs; bpftrace compiles internally)
    ▼
  Load         bpf(BPF_PROG_LOAD, ...) system call      (needs CAP_BPF or root)
    │
    ▼
  Verify       the kernel verifier walks every possible path
    │            └── unsafe? ──► load rejected, nothing runs
    ▼
  JIT          bytecode ──► native x86-64 / arm64 instructions
    │
    ▼
  Attach       to a hook: tracepoint, kprobe, uprobe, XDP, tc, cgroup, LSM ...
    │
    ▼
  Run          every time the hook fires (possibly millions of times per second)
    │
    ▼
  Share        eBPF maps  ◄────►  user-space tool reads and writes them
Two of these steps make eBPF different from everything that came before: the verifier, which makes it safe, and maps, which make it useful.
The eBPF Verifier: Why Your Program Can't Crash the Kernel
Before a single instruction runs, the kernel's verifier simulates the program and explores every branch. It refuses to load the program unless it can prove that:
- every path reaches an exit, so the program can never hang the kernel (bounded loops are allowed since Linux 5.3; unbounded ones are not)
- every memory access stays inside memory the program is allowed to touch
- no register is read before it has been written
- it only calls kernel helpers and kfuncs permitted for its program type
- it fits the limits: 512 bytes of stack, and no more than one million instructions explored during verification
You give up arbitrary freedom, and in return the kernel guarantees your program cannot take the machine down.
Here's the verifier error almost every eBPF developer meets in their first week. This program counts openat() calls per process:
#include "vmlinux.h"
#include <bpf/bpf_helpers.h>

struct {
    __uint(type, BPF_MAP_TYPE_HASH);
    __uint(max_entries, 10240);
    __type(key, u32);
    __type(value, u64);
} counts SEC(".maps");

SEC("tracepoint/syscalls/sys_enter_openat")
int count_openat(void *ctx)
{
    u32 pid = bpf_get_current_pid_tgid() >> 32;
    u64 *val = bpf_map_lookup_elem(&counts, &pid);

    *val += 1;   /* rejected: R0 invalid mem access 'map_value_or_null' */
    return 0;
}

char LICENSE[] SEC("license") = "GPL";
The lookup can return NULL when the key doesn't exist yet, so dereferencing it unchecked is a potential kernel crash. The verifier spots that path and refuses to load the program. The fix is to handle both cases:
    u64 *val = bpf_map_lookup_elem(&counts, &pid);
    if (val) {
        __sync_fetch_and_add(val, 1);
    } else {
        u64 one = 1;
        bpf_map_update_elem(&counts, &pid, &one, BPF_ANY);
    }
To watch the rejection happen yourself, generate vmlinux.h (explained in the CO-RE section below), compile, and try to load the broken version:
bpftool btf dump file /sys/kernel/btf/vmlinux format c > vmlinux.h
clang -O2 -g -target bpf -c count_openat.bpf.c -o count_openat.bpf.o
sudo bpftool prog load count_openat.bpf.o /sys/fs/bpf/count_openat
The headline error reads BPF program load failed: Permission denied, because the verifier rejects programs with EACCES. That message has sent plenty of engineers off to double-check their sudo setup. Keep scrolling: the verifier log underneath walks through the program instruction by instruction and ends on the R0 invalid mem access line.
Who may load a program is a separate question from what the program can do. Loading most program types requires privileges: CAP_BPF (Linux 5.8+) together with CAP_PERFMON for tracing or CAP_NET_ADMIN for networking, or simply root. Most distributions also disable unprivileged eBPF entirely, partly because verifier bugs and CPU side-channel attacks have both turned it into an attack surface over the years:
sysctl kernel.unprivileged_bpf_disabled
# 1 or 2 = unprivileged users cannot load eBPF programs
Linux 6.9 added a middle ground called BPF tokens. A privileged daemon, such as a container manager, can delegate a narrow slice of BPF (specific commands, map types and program types) to a trusted container through a bpffs mount, without handing it CAP_BPF.
JIT: From Bytecode to Native Speed
Once verified, the bytecode is translated by a just-in-time compiler into native machine instructions for your CPU. That is why eBPF can sit in the packet path or on a hot kernel function without a noticeable slowdown: after loading, it runs as ordinary compiled code.
sysctl net.core.bpf_jit_enable
# 1 = JIT enabled. Many kernels are built with CONFIG_BPF_JIT_ALWAYS_ON,
# so the slower interpreter isn't even compiled in.
eBPF Hooks: Where Programs Attach
A loaded program does nothing until it is attached to a hook, an event inside the kernel (or a user-space process) that triggers it. The hook decides what the program can see and what it can change:
| Hook | Fires when | Typical use | Used by |
|---|---|---|---|
| Tracepoints | A predefined kernel event: syscalls, scheduler, block I/O, TCP | Observability that rarely breaks across kernel upgrades | bpftrace, BCC tools |
| kprobes / kretprobes | Entry or return of almost any kernel function | Deep debugging; internal functions can change between kernels | bpftrace, BCC tools |
| fentry / fexit | Entry or return of a kernel function, through BTF trampolines (x86-64 since 5.5, arm64 since 6.4) | Lower-overhead tracing with typed arguments; same upgrade risk as kprobes | libbpf-based tools, bpftrace |
| uprobes / uretprobes | Entry or return of a user-space function (e.g. in libssl or a Go binary) | Tracing applications without code changes | OpenTelemetry eBPF Instrumentation (Grafana Beyla), Pixie, bpftrace |
| XDP | A packet reaches the NIC driver, before the kernel allocates an sk_buff for it (native mode needs driver support) | DDoS dropping, load balancing at line rate | Cilium, Katran |
| tc (traffic control) | Packet ingress or egress on an interface (tcx on 6.6+ kernels) | Container networking, policy, NAT | Cilium |
| cgroup hooks | Socket connect/bind, cgroup ingress/egress, device access | Per-pod policy, socket-level load balancing, device control | Cilium, systemd, container runtimes |
| LSM (BPF LSM) | Kernel security checks such as file open or exec (5.7+; bpf must be in the kernel's lsm= list) | Runtime security enforcement | Tetragon, KubeArmor |
| struct_ops | The kernel calls into a table of operations that an eBPF program implements | Custom TCP congestion control, CPU scheduling policy (sched_ext, 6.12+) | sched_ext schedulers (scx) |
| perf events | A CPU sampling timer or hardware counter fires | Continuous profiling | Parca, Pyroscope |
Two practical rules come out of this table. For observability that has to survive kernel upgrades, prefer tracepoints. fentry/fexit are the cheaper way to hook a kernel function, but they attach to the same internal functions kprobes do, so a rename or an inlining breaks them just as badly. For networking, the earlier the hook, the cheaper the work: XDP can drop a packet before the kernel has built an sk_buff for it.
eBPF Maps: How Programs Remember Things
An eBPF program keeps no state between runs. Each time a hook fires, the program starts fresh. Anything that has to persist, such as counters, histograms, connection tables or configuration, lives in maps: key/value data structures in kernel memory that both eBPF programs and user-space tools can read and write.
- Hash and array maps: general-purpose lookups and counters
- Per-CPU variants: each CPU updates its own copy, so counters need no locks
- LRU hash: evicts old entries automatically, ideal for connection tracking
- LPM trie: longest-prefix match, which is how CIDR-based network policy is checked
- Ring buffer (Linux 5.8+): streams events to user space efficiently
- Program arrays: let one program jump into another (tail calls)
Maps are why Cilium can replace kube-proxy. In iptables mode, kube-proxy expresses every Service as chains of rules that packets walk in order, so the cost grows as you add Services and endpoints. Cilium stores Services and their backends in eBPF hash maps, so finding a backend takes a couple of constant-time lookups no matter how many Services the cluster has.
To be fair to kube-proxy, its nftables mode, GA since Kubernetes 1.33, also uses map lookups and closes much of that gap. Cilium's remaining edge is where the work happens: for pod-to-Service traffic it can rewrite the destination once, when the socket calls connect(), instead of translating every packet.
BTF and CO-RE: Why Modern Tools Don't Need Kernel Headers
Kernel data structures differ between kernel versions. A field that is at offset 24 in one kernel may be at offset 32 in the next. Early eBPF tools (the classic BCC approach) handled this by compiling the program on the node at startup, which meant installing LLVM and the exact kernel headers on every machine and waiting for a compile each time a tool started.
Modern eBPF solves this with two pieces:
- BTF (BPF Type Format): the kernel describes its own data structures in a compact format, exposed at
/sys/kernel/btf/vmlinux. - CO-RE (Compile Once, Run Everywhere): the loader (libbpf, or cilium/ebpf in Go) reads the running kernel's BTF and rewrites field offsets at load time, so a program compiled once runs on many kernel versions.
# Does this kernel expose BTF?
ls -l /sys/kernel/btf/vmlinux

# Generate a header with every kernel type, used by CO-RE programs
bpftool btf dump file /sys/kernel/btf/vmlinux format c > vmlinux.h
If /sys/kernel/btf/vmlinux exists, most modern eBPF tooling, including Falco's modern eBPF probe and the libbpf-based tools, can run without kernel headers.
Hands-On: See What eBPF Is Already Running on Your Node
You may never have installed an eBPF tool, but your servers are almost certainly running eBPF programs already. On a cgroup v2 system, systemd uses them for per-service IP accounting and filtering, and container runtimes use them to control which devices a container may access.
bpftool is the standard way to look:
sudo bpftool prog list          # every loaded eBPF program
sudo bpftool map list           # every map and its type and size
sudo bpftool net list           # XDP and tc programs attached to interfaces
sudo bpftool cgroup tree        # programs attached to cgroups
sudo bpftool feature probe | grep -i -E 'program_type|map_type' | head -40
sudo ls /sys/fs/bpf             # pinned programs and maps (Cilium pins its maps here)
Example output (trimmed):
48: cgroup_device  tag 3b8e4e4d9f2c71a0
        loaded_at 2026-10-30T09:12:44+0000  uid 0
        xlated 504B  jited 309B  memlock 4096B
112: sched_cls  name cil_from_container  tag 9f1c2e7a5b3d4f60  gpl
        loaded_at 2026-10-30T09:13:02+0000  uid 0
        xlated 46480B  jited 26520B  memlock 49152B  map_ids 21,37,40
The first is a device-access program a container runtime attached to a container's cgroup. The second is part of Cilium's datapath, a tc (sched_cls) program handling traffic leaving a pod. If you find programs on a node that you cannot explain, treat that as a security finding (more on that below).
Three bpftrace One-Liners Worth Memorizing
bpftrace compiles a one-line script into an eBPF program, attaches it, and prints results when you press Ctrl-C. These three earn their keep:
# 1. Every new program started on the node, live
sudo bpftrace -e 'tracepoint:sched:sched_process_exec { printf("%-8d %s\n", pid, comm); }'

# 2. Which processes make the most system calls
sudo bpftrace -e 'tracepoint:raw_syscalls:sys_enter { @[comm] = count(); }'

# 3. Latency histogram of file reads (in nanoseconds)
#    vfs_read has no tracepoint, so a kprobe is the right tool here
sudo bpftrace -e 'kprobe:vfs_read { @start[tid] = nsecs; }
  kretprobe:vfs_read /@start[tid]/ { @ns = hist(nsecs - @start[tid]); delete(@start[tid]); }'
For common questions you don't need to write anything. The BCC tool collection ships ready-made tools: execsnoop, opensnoop, tcpretrans, biolatency and runqlat, among many others. On Ubuntu they come from the bpfcc-tools package with a -bpfcc suffix (tcpretrans-bpfcc, as in the opening story); on RHEL-family systems they live in /usr/share/bcc/tools/ from the bcc-tools package.
One catch: classic BCC tools compile their eBPF code each time they start, so they also need kernel headers that match the running kernel (linux-headers-$(uname -r) on Ubuntu). Without them, the tool dies with an error pointing at /lib/modules/<version>/build. Put both packages in your node image now, so they are already there at 3:40 PM.
One container-specific detail: these tools report host PIDs and process names, because eBPF runs in the kernel, outside every namespace. To map a PID back to a pod, read its cgroup path with cat /proc/<pid>/cgroup, or see Under the Hood #8 for working across namespaces with nsenter. And notice that the PID column in the opening story was 0. Retransmits fire from kernel timers and softirqs, not from your process, so tcpretrans records whatever happened to be on the CPU at that moment, which is usually the kernel itself. The IP and port pair is what tells you which pod is affected.
eBPF in Kubernetes: Who's Using It on Your Nodes
- Cilium: CNI and optional kube-proxy replacement. Pod networking, Service load balancing and network policy run as eBPF programs on tc, XDP and cgroup hooks. See our deep dive on eBPF Kubernetes networking with Cilium and Hubble.
- Hubble: network flow visibility built on events from Cilium's eBPF datapath.
- Falco: runtime threat detection from system calls. Its CO-RE "modern eBPF" probe has been the default driver since Falco 0.38.
- Tetragon: security observability that can also enforce policy in the kernel, for example killing a process the moment it does something forbidden.
- OpenTelemetry eBPF Instrumentation and Pixie: automatic request tracing and metrics using uprobes and kprobes, with no code changes or sidecars. OBI started life as Grafana Beyla, which Grafana donated to OpenTelemetry in 2025; Beyla continues as Grafana's distribution of it.
- Parca and Pyroscope: always-on CPU profiling of every process on the node via perf-event sampling.
If Cilium runs your cluster networking, its view of the eBPF datapath is one command away. Target the agent on the node you're investigating, because kubectl exec ds/cilium lands on an arbitrary node:
NODE=<node-name>
CILIUM_POD=$(kubectl -n kube-system get pod -l k8s-app=cilium \
  --field-selector spec.nodeName=$NODE -o name)

kubectl -n kube-system exec $CILIUM_POD -c cilium-agent -- cilium-dbg status --verbose
kubectl -n kube-system exec $CILIUM_POD -c cilium-agent -- cilium-dbg bpf lb list   # Service → backends, straight from the map
# (the in-agent CLI was called "cilium" before Cilium 1.15)
What eBPF Can't Do, and Where It Bites
Privileged eBPF is root on the node. The verifier protects the kernel from crashing, not from being spied on or manipulated. A program with tracing privileges can read kernel and process memory; networking programs can rewrite or drop any packet. eBPF rootkits are real, with public proofs of concept such as ebpfkit and TripleCross. Treat every eBPF agent as privileged infrastructure, never grant CAP_BPF or CAP_SYS_ADMIN to application pods, and audit nodes with bpftool prog list, keeping in mind that a determined rootkit will try to hide from it.
The kernel version matters. eBPF has grown feature by feature: bounded loops (5.3), BPF LSM (5.7), ring buffers and CAP_BPF (5.8) and BPF tokens (6.9) all arrived in different releases. A tool that works on your 6.x test node may refuse to start on an older 5.4 node pool. Check uname -r and bpftool feature probe before rolling anything out.
It isn't free. A program on a function called millions of times per second costs CPU on every call. Good tools aggregate inside the kernel (counts, histograms) and send summaries to user space; naive ones stream every event and become the performance problem they were meant to find.
Verifier errors can be cryptic. Large programs can hit the complexity limit, and the error messages point at registers rather than your source code. That matters if you write eBPF; if you only run eBPF tools, it doesn't.
5 Common eBPF Mistakes
- Treating eBPF agents as harmless "read-only" tools. They run with near-total visibility into the node. Review them like any other privileged DaemonSet.
- Streaming every event to user space. Aggregate in maps first and ship summaries.
- Using a kprobe (or fentry) where a tracepoint exists. Both keep working only until a kernel upgrade renames or inlines the function.
- Assuming every node has the same kernel. Mixed node pools mean mixed eBPF features, and arm64 nodes picked up some of them (fentry, for one) years after x86. Test on the oldest kernel you run.
- Debugging Cilium with iptables. With kube-proxy replacement, the Service rules aren't in iptables at all. (Even with kube-proxy, a plain
iptables -Lonly shows the filter table; Service NAT rules live in-t nat.) Usecilium-dbgandbpftool.
The eBPF Cheat Sheet
| Question | Command |
|---|---|
| Which eBPF programs are loaded? | sudo bpftool prog list |
| Which maps exist? | sudo bpftool map list |
| What is attached to network interfaces? | sudo bpftool net list |
| What is attached to cgroups? | sudo bpftool cgroup tree |
| What does this kernel support? | sudo bpftool feature probe |
| Does the kernel expose BTF (CO-RE ready)? | ls /sys/kernel/btf/vmlinux |
| Can unprivileged users load eBPF? | sysctl kernel.unprivileged_bpf_disabled |
| What programs are starting right now? | sudo execsnoop-bpfcc |
| Where are TCP retransmits going? | sudo tcpretrans-bpfcc (RHEL: /usr/share/bcc/tools/tcpretrans) |
| What is the disk I/O latency distribution? | sudo biolatency-bpfcc |
| How does Cilium map a Service to backends on this node? | kubectl -n kube-system exec $CILIUM_POD -c cilium-agent – cilium-dbg bpf lb list |
eBPF FAQ
Is eBPF safe to run in production?
Yes, with one caveat. The verifier stops an eBPF program from crashing or hanging the kernel, and tools like Cilium, Falco and Tetragon run on large production fleets. But a privileged eBPF program can read memory and rewrite packets, so treat every eBPF agent as root-level infrastructure and audit what is loaded with bpftool prog list.
Does eBPF replace kernel modules?
For observability, networking and security policy, mostly yes. Work that once needed a custom module can now be done with an eBPF program that loads at runtime and can't panic the kernel. Device drivers and anything that needs unrestricted kernel access still require modules, because the verifier deliberately limits what eBPF code can do.
What kernel version do I need for eBPF?
eBPF has been in the kernel since 3.18, and most tracing features arrived during the 4.x series. Modern tooling expects 5.8 or newer, which brings the BPF ring buffer and CAP_BPF, and CO-RE tools such as Falco's modern eBPF probe also need BTF at /sys/kernel/btf/vmlinux. Check with uname -r and bpftool feature probe.
Is eBPF only for networking?
No. The name comes from packet filtering, but eBPF now powers tracing and performance analysis (bpftrace, BCC), runtime security (Falco, Tetragon), continuous profiling (Parca, Pyroscope), zero-code application tracing (OpenTelemetry eBPF Instrumentation) and, since Linux 6.12, custom CPU scheduling through sched_ext.
What is the difference between BCC, bpftrace and libbpf?
bpftrace is a high-level language for one-liners and short scripts. BCC is a toolkit of ready-made tools like tcpretrans and execsnoop that compile on each run, so they need kernel headers. libbpf is the C library modern CO-RE tools use to load precompiled eBPF programs on any kernel with BTF. Start with bpftrace and BCC; reach for libbpf when you build your own tool.
Can eBPF see inside containers?
Yes. eBPF runs in the kernel, below every namespace, so it sees the processes, system calls and network traffic of every container on the node. Tools report host PIDs, though. Map a PID to its pod with cat /proc/<pid>/cgroup, or use Kubernetes-aware tools like Hubble, Tetragon or Falco that attach pod metadata for you.
Key Takeaways
- eBPF runs sandboxed programs inside the Linux kernel without kernel modules or reboots.
- The verifier proves a program is safe before it runs; the JIT then makes it run at native speed.
- Programs attach to hooks (tracepoints, kprobes, fentry, uprobes, XDP, tc, cgroup, LSM, struct_ops) and keep state in maps.
- BTF and CO-RE let one compiled program run across kernel versions without headers on the node.
- Cilium, Falco, Tetragon, OpenTelemetry eBPF Instrumentation and modern profilers are all eBPF underneath.
- A privileged eBPF program is effectively root on the node, verifier or not.
Back to 3:40 PM
eBPF changes where operational questions get answered. Instead of guessing from metrics collected far away from the problem, you ask the kernel directly, on the node where the problem lives, while it is still happening, without restarting anything.
It also ties this series together. The cgroups that limit your containers now enforce device access with eBPF. The Linux networking stack your pods depend on can be reprogrammed with it. And the namespaces that isolate containers are exactly what eBPF sees across, because it runs below all of them.
If you take one action from this article, make it this: put bpftrace, or bpfcc-tools plus matching kernel headers, into your node image this week. The thirty-second diagnosis in the opening story only works if the tool is already on the box.
Next time a node misbehaves and the dashboards shrug, don't restart first. Ask the kernel.
Further Reading
- ebpf.io: the community hub, with project listings and introductions
- Linux kernel BPF documentation: the verifier, program types, maps and helpers, from the source
- Brendan Gregg's eBPF page: the tracing tools, one-liners and talks that made eBPF observability mainstream
- RFC 9669: the standardized eBPF instruction set