The Life of a Kubernetes Pod: Millisecond by Millisecond
Trace the millisecond journey of a Kubernetes Pod from kubectl apply to live traffic. Learn how the API Server, etcd, Scheduler, Kubelet, CNI, and readiness probes coordinate behind the scenes in this step-by-step architecture deep dive.
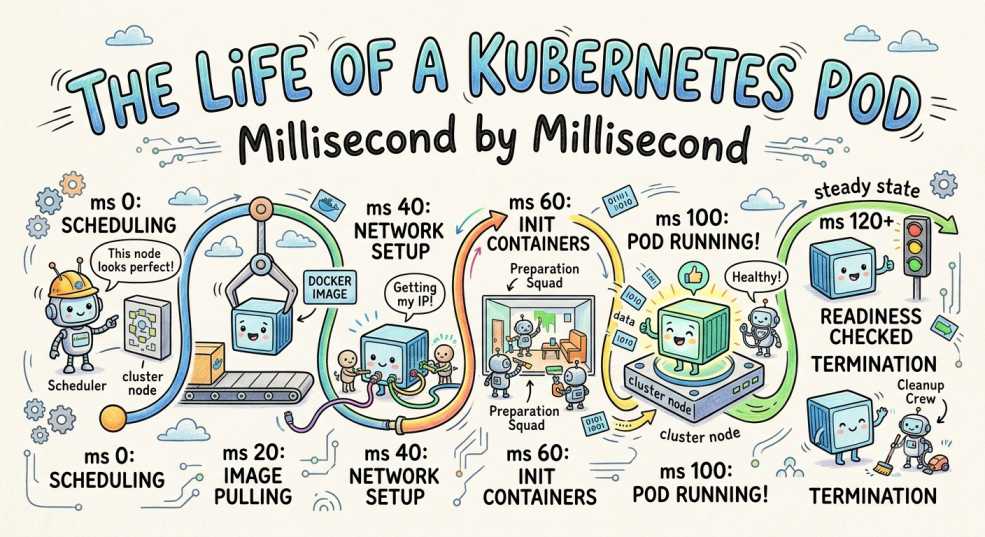
You type one standard command into your terminal:
kubectl apply -f nginx.yaml
In a second, kubectl get pods shows your application as Running.
To anyone watching the terminal, it feels instantaneous. But under the hood, dozens of asynchronous control loops, network calls, and kernel-level isolations just fired in a tight sub-second sequence. The API server validated your schema, etcd locked in your desired state, the scheduler picked the optimal node, kubelet handed off work to the container runtime, CNI configured your virtual interface, and readiness probes finally opened the floodgates for live traffic.
Here is what actually happens during those few hundred milliseconds, step by step.
Step-by-Step Architecture Flow
[ kubectl ]
    │ (HTTP POST JSON)
    ▼
[ kube-apiserver ] ─── (Write Desired State) ───> [ etcd ]
    │                                                │
    ├──────> [ kube-scheduler ] (Watch & Assign) ────┘
    │
    └──────> [ kubelet ] (Watch & Local Execution)
                 ├──> [ CRI / containerd ]
                 ├──> [ CNI Plugin ]
                 └──> [ CSI / Volumes ]
1. kubectl Builds and Sends the Request
kubectl doesn't create pods. It’s simply a command-line HTTP client compiled in Go.
When you hit Enter, kubectl:
- Reads
~/.kube/configto pull your target cluster endpoint, client certificates, or bearer tokens. - Converts your YAML manifest into a structured JSON payload.
- Issues an HTTP
POSTrequest to the API server at/api/v1/namespaces/default/pods.
2. API Server Validates the Manifest
The kube-apiserver acts as the single front door to the cluster. Every request passes through a strict sequential pipeline before anything touches the database:
- Authentication: Checks who you are (certs, service accounts, or OIDC tokens).
- Authorization (RBAC): Checks if your user identity has
createpermissions on thepodsresource. - Mutating Admission Webhooks: Injects defaults, sidecar containers (like Istio), or custom annotations.
- Schema Validation: Verifies field types, required keys, and formatting.
- Validating Admission Webhooks: Enforces cluster-wide policies (e.g., Kyverno or OPA gatekeeper rules blocking root users).
If your image tag is formatted wrong or you lack permissions, the pipeline stops here and returns an HTTP 4xx error back to your terminal.
3. Desired State Is Stored in etcd
Here is where many engineers get tripped up: Kubernetes doesn't start containers when you run kubectl apply.
Once the request passes validation, kube-apiserver writes the Pod manifest straight into etcd the cluster's distributed key-value store.
This is the core philosophy of Kubernetes: control loops and declarative state. The API server simply records, "The cluster should have 1 Pod named nginx running." Once etcd acknowledges the write, the API server returns a success response to kubectl. The actual work of making it happen occurs asynchronously.
4. Scheduler Notices the New Pod
The kube-scheduler isn't invoked directly. Instead, it maintains a persistent HTTP connection to the API server using the Watch API.
When etcd gets updated, the API server notifies all watching controllers. The scheduler sees a new Pod object where .status.phase is Pending and .spec.nodeName is empty. It immediately places the Pod into its internal scheduling queue.
5. Filtering Nodes (Predicates)
The scheduler must choose a home for the Pod. First, it runs a filtering phase to eliminate candidate nodes that can't run the workload:
- Resource availability: Does the node have enough unreserved CPU and RAM (
NodeResourcesFit)? - Taints and Tolerations: Does the node have a taint that this Pod lacks a toleration for?
- Node Selectors & Affinity: Does the node match mandatory label criteria like
disktype=ssd? - Unschedulable Flag: Is the node cordoned off for maintenance?
10 Cluster Nodes ──> [ Filter Out 7 Unsuitable Nodes ] ──> 3 Candidate Nodes
6. Scoring Candidate Nodes (Priorities)
If multiple nodes survive the filtering phase, the scheduler scores them on a scale of 0 to 100.
It evaluates algorithms such as:
- LeastRequestedPriority: Favors nodes with lower overall resource utilization to keep workloads balanced across the cluster.
- ImageLocalityPriority: Gives extra points to nodes that already have the required container image layers cached locally, speeding up startup times.
- TopologySpread: Spreads replicas across different availability zones to prevent single-point-of-failure outages.
The node with the highest cumulative score wins.
7. Binding the Pod to a Node
Once the scheduler selects a node (say, worker-node-03), it doesn't log into that node.
Instead, it sends a Binding object back to the API server, setting the Pod's .spec.nodeName field to worker-node-03.
At this point, the scheduler's job is completely done.
8. kubelet Takes Over
Every worker node runs a daemon called the kubelet.
Like the scheduler, the kubelet on worker-node-03 watches the API server. The moment it sees a Pod assigned to its own node name, it grabs the spec and initiates its local sync loop to build the Pod.
9. Container Runtime (CRI) Prepares the Environment
To start the actual containers, kubelet makes gRPC calls to the local Container Runtime Interface (CRI), usually containerd or CRI-O.
The runtime handles the low-level host operations:
- Pulls missing image layers from the container registry.
- Sets up Linux namespaces (
net,pid,mnt,ipc,uts) for isolation. - Configures
cgroupsto enforce CPU and memory limits. - Starts a tiny Pause Container (infrastructure container) that holds open the shared network namespace for all containers inside the Pod.
10. CNI Provisions the Network Interface
With the namespace created, the runtime invokes the Container Network Interface (CNI) plugin such as Cilium, Calico, or Flannel.
The CNI plugin:
- Requests a unique IP address from the cluster's Pod CIDR subnet.
- Sets up a virtual Ethernet pair (
veth) connecting the Pod's network namespace to the host bridge or eBPF datapath. - Generates the Pod's local
/etc/resolv.confso it can resolve internal cluster names via CoreDNS.
11. Volumes Are Mounted
Before your application process boots, kubelet prepares storage:
- Mounts projected resources like
ConfigMaps,Secrets, and Service Account tokens. - Creates
emptyDirtemporary volumes if defined. - Calls the CSI (Container Storage Interface) driver if your Pod requests persistent cloud disks (
PersistentVolumeClaim).
12. Application Process Launches
Now that storage, network, and namespaces are locked in, the runtime executes your application entry point (PID 1) inside the main container.
The Pod's status changes from Pending to Running in the API server. However, it is still not allowed to receive external web traffic.
13. Health Probes Take Over
The kubelet executes health checks defined in your manifest to track application readiness:
- Startup Probe: Gives slow-booting applications time to initialize before other probes kick in.
- Readiness Probe: Confirms whether the app is ready to serve traffic (e.g., DB connections established). If this fails, the Pod stays out of service load balancers.
- Liveness Probe: Periodically checks if the application is healthy. If it fails,
kubeletkills and restarts the container based on your restart policy.
14. Endpoint Controllers Route Live Traffic
Once your Readiness Probe returns a successful response:
- The EndpointSlice Controller sees the Pod is ready and adds its IP address to the matching Service's
EndpointSlicelist. kube-proxy(or Cilium's eBPF agent) updates localiptablesor eBPF routes across every worker node.- Ingress controllers and cloud load balancers start forwarding live incoming traffic directly to the Pod's IP.
Now your users are hitting the application.
15. Continuous Reconciliation Loops
The story doesn't end once traffic flows.
Kubernetes controllers run continuous reconciliation loops. If a process crashes, kubelet restarts the container. If a node dies, the control plane notices missing heartbeats and reschedules the Pod on a healthy node. The system constantly aligns the actual state with the desired state recorded in etcd.
Millisecond Execution Timeline
(Note: Times below are typical benchmarks on a healthy cluster with pre-cached container images.)
Manifest parsed to JSON and sent via HTTPS POST to API server.
Authentication, RBAC checks, and admission webhooks complete.
Desired state saved in etcd; API server returns 200 OK to client.
Scheduler picks up unassigned Pod via Watch API event stream.
Predicates and priority scoring determine winning target node.
Scheduler updates Pod .spec.nodeName in API server.
Target node's kubelet detects assigned Pod and invokes CRI runtime.
Pause container created, virtual Ethernet pair attached, IP assigned.
ConfigMaps/Secrets mounted; application process launches (PID 1).
Readiness probe passes; EndpointSlice updated; load balancer routes traffic.
4 Common Kubernetes Misconceptions
| Common Myth | Technical Reality |
| "kubectl creates Pods." | kubectl is just an HTTP client that posts JSON to kube-apiserver. |
| "The Scheduler starts containers." | The scheduler only writes a node's hostname into .spec.nodeName. It never talks to container runtimes. |
| "A Running Pod receives traffic immediately." | Running just means PID 1 started. Traffic is blocked until Readiness Probes pass. |
| "A Pod is just a Docker container." | A Pod is a shared execution environment (namespaces, cgroups, network IP) hosting one or more co-located containers. |
Practical Troubleshooting Takeaways
When a pod fails to launch, knowing this timeline tells you exactly where to look:
- Stuck in
Pendingwith no node listed? Checkkube-schedulerlogs orkubectl describe podfor unfulfilled constraints (affinity, resource limits, or taints). - Stuck in
ContainerCreating? The issue is almost always local to the node—checkkubelet, CNI network allocation, or volume mounting timeouts. - Status is
Runningbut no traffic arriving? Check your Readiness Probe path and endpoint slice configurations (kubectl get endpointslices).
For a visual breakdown of how these phases transition during creation and failure modes, check out this video tutorial on Kubernetes Pod Lifecycle Explained: Pending to Running. It provides a clear walkthrough of how kubectl commands map directly to container states and probes in real time.