How to Debug Kubernetes in Production When kubectl Logs Fail
When kubectl logs goes silent, standard troubleshooting stops. Discover the step-by-step playbook senior DevOps and SRE teams use to debug Kubernetes in production, covering kubectl describe, ephemeral containers, crictl, journalctl, strace, and eBPF kernel tracing.
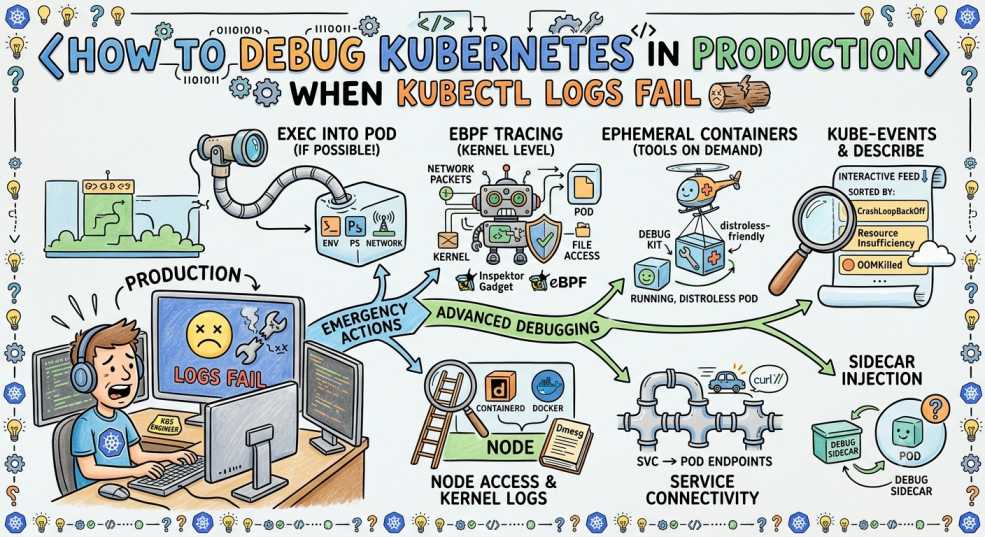
Your PagerDuty fires an alert: CheckoutServiceHigh502ErrorRate.
You jump out of bed, grab your laptop, open your terminal, and run the first command every Kubernetes operator types when things break:
kubectl logs -n production checkout-api-7d48858d4d-z92kl --tail=100
The output rolls past:
2026-08-05T21:14:02Z INFO  [server] Listening on port 8080
2026-08-05T21:14:15Z INFO  [health] Healthcheck GET /healthz 200 OK
2026-08-05T21:14:30Z INFO  [health] Healthcheck GET /healthz 200 OK
Nothing. No stack traces. No unhandled exceptions. No ERROR lines.
Application logs only tell you what the application knows went wrong. When the failure occurs underneath the application code at the scheduler, CNI network layer, kernel, or container runtime kubectl logs goes silent.
Here is the step-by-step playbook senior DevOps and SRE teams use when application logs tell you nothing.
What kubectl logs Sees (And What It’s Blind To)
Before jumping into tools, it helps to understand why kubectl logs fails.
kubectl logs reads standard output (stdout) and standard error (stderr) streams piped from the container process to the node’s file system (typically stored under /var/log/pods/).
| What kubectl logs Can Catch | What kubectl logs Misses Entirely |
| Unhandled code exceptions | Kernel OOM kills before the process can flush logs |
| Missing application dependencies | CNI plugin packet drops or DNS lookup timeouts |
| Database connection string errors | Scheduler resource constraints & taints |
| Unhandled HTTP 500 errors | Mount failures on Persistent Volumes |
When logs fail, you need to climb down the stack: from Kubernetes metadata, to active containers, to host daemons, to the Linux kernel.
Phase 1: Kubernetes Metadata & Control Plane
Step 1: kubectl describe pod
Before leaving kubectl, check what the control plane thinks is happening. kubectl describe exposes object state that standard logs never touch.
kubectl describe pod checkout-api-7d48858d4d-z92kl -n production
Pay special attention to two sections:
State/Last State: Did the container crash silently? Look forExit Code 137(Out Of Memory / SIGKILL) orExit Code 139(Segmentation Fault).Conditions: Are readiness or liveness probes failing while the process is technically still running?
Step 2: Correlate Cluster Events
Cluster events tell the timeline story before application boot. Often, engineers miss events because standard kubectl get events dumps an unsorted wall of text.
Sort events chronologically for the specific namespace:
kubectl get events -n production --sort-by='.metadata.creationTimestamp'
Look for critical event warnings that happen outside the application process:
FailedScheduling: No node fits resource requests or taints.FailedMount: Storage CSI driver failed to attach the volume.FailedCreatePodSandBox: CNI plugin failed to assign an IP address.
Phase 2: Active Container & Network Inspection
Step 3: The kubectl exec Trap
When a Pod is Running but misbehaving, your first instinct might be to exec inside:
kubectl exec -it checkout-api-7d48858d4d-z92kl -n production -- /bin/sh
However, in modern production environments:
- Containers are built minimal (
distroless,scratch, oralpine), lackingcurl,dig,netstat, or even a shell. - If the container is stuck in
CrashLoopBackOff,execfails instantly because the target container is dead.
Step 4: kubectl debug (Ephemeral Containers)
Instead of rebuilding production images with debugging tools or editing manifests in live clusters, attach an Ephemeral Debug Container.
An ephemeral container shares the execution namespaces (network, PID, IPC) of your target Pod without restarting it:
kubectl debug -it checkout-api-7d48858d4d-z92kl \
  -n production \
  --image=nicolaka/netshoot \
  --target=checkout-api
Once inside the netshoot container, you have a complete diagnostic toolkit (curl, dig, tcpdump, iperf, nmap) running directly inside the target Pod's network namespace:
# Test internal DNS resolution from inside the Pod's namespace
dig payment-service.production.svc.cluster.local

# Check if port is open
nc -zv payment-service.production.svc.cluster.local 8080
Phase 3: Node-Level Runtime & Host Inspection
When kubectl commands hang, return timeouts, or yield inconsistent information, the API server itself might be disconnected from the node. You must SSH into the worker node directly.
Step 5: crictl (Bypassing the API Server)
The crictl CLI talks directly to the local Container Runtime Interface (containerd or CRI-O) over its Unix socket on the host, completely bypassing kube-apiserver and kubelet.
# SSH into worker node
ssh [email protected]

# List local containers running on this node
sudo crictl ps

# Inspect raw container status and low-level cgroup state
sudo crictl inspect <container-id>
If kubectl reports a Pod as Running but crictl ps shows the container continually cycling or missing, you are dealing with a local runtime sync issue.
Step 6: journalctl (Daemon System Logs)
If containers aren't starting or network devices are missing, check the node's systemd services:
# Inspect kubelet service logs
sudo journalctl -u kubelet -n 100 --no-pager

# Inspect containerd logs
sudo journalctl -u containerd -n 100 --no-pager
Common failures hidden in journalctl:
- Node running out of file descriptors (
too many open files). - Disk pressure causing
kubeletto aggressively prune image layers. - CNI binary crashes or IPAM allocation exhaustion.
Phase 4: Linux Kernel & Network Tracing
Step 7: nsenter (Namespace Hopping)
Linux containers are simply isolated processes on a shared host kernel. nsenter allows you to enter any container's Linux namespace directly from the host system.
Enter the container's network namespace using host tools:
sudo nsenter -t $PID -n ip addr
sudo nsenter -t $PID -n netstat -tulpn
Find the Process ID (PID) of the container process on the worker node:
PID=$(sudo crictl inspect --output json <container-id> | jq '.status.pid')
This is invaluable when you need host-level diagnostics without installing extra binaries inside the container or launching new pods.
Step 8: strace (Tracing System Calls)
When a process hangs completely consuming 0% CPU and serving no traffic while application logs remain blank, it is usually blocked on a system call (e.g., waiting for an unresponsive socket or file lock).
Attach strace directly to the container process from the host:
# Trace network and file access syscalls for the target process
sudo strace -p $PID -f -e trace=network,file,connect,read,write
If the output freezes at connect(...) or futex(...), you have instantly pinpointed the deadlocked resource or external IP dependency.
Step 9: tcpdump (Packet Capture)
When dealing with intermittent 502s, connection resets, or TLS handshake failures, application logs often show generic messages like Connection reset by peer.
Run a raw packet capture on the host or inside the container's network interface:
# Capture DNS traffic on the host interface for the container
sudo tcpdump -i any port 53 -n -v
Look for:
- UDP DNS timeouts: CoreDNS instances failing under load.
- TCP SYN retransmissions: Dropped packets due to firewall rules or misconfigured MTU settings on CNI overlays.
Phase 5: eBPF Deep Observability
Step 10: Kernel Tracing with eBPF
Traditional tools like strace introduce performance overhead when run against high-throughput production workloads. eBPF (Extended Berkeley Packet Filter) solves this by executing sandboxed programs directly inside the Linux kernel.
Tools like bpftrace, Inspektor Gadget, or Cilium allow you to trace kernel calls with near-zero overhead:
# Trace failed TCP connections across the node in real time using Inspektor Gadget
kubectl gadget trace tcp -n production
eBPF lets you observe socket allocations, dropped packets, and short-lived process executions that vanish too quickly for traditional polling tools to catch.
The Production Debugging Flowchart
Save this decision tree for your next incident:
               +-----------------------+
               |  Application Problem  |
               +-----------+-----------+
                           |
                           v
                 [ kubectl logs ]
                           |
                  Is it informative?
                 /                  \
              YES                    NO
              /                        \
    +-----------------+        v
    | Fix App Code /  |   [ kubectl describe & events ]
    | Configuration   |        |
    +-----------------+   Any Kubernetes errors?
                           /            \
                        YES              NO
                        /                  \
             +--------------------+         v
             | Fix Mounts, Taints,|   [ kubectl debug ]
             | Resources, Probes  |   (Ephemeral Netshoot)
             +--------------------+         |
                                     Can you reach dependencies?
                                    /           \
                                 YES             NO
                                 /                 \
                      +------------------+          v
                      | Trace Syscalls   |   [ Node Investigation ]
                      | (strace / eBPF)  |   (journalctl / crictl)
                      +------------------+          |
                                             Is CNI / Node healthy?
                                            /           \
                                         YES             NO
                                         /                 \
                              +------------------+   +-------------------+
                              | Capture Packets  |   | Fix Kubelet / CNI |
                              | (tcpdump)        |   | or Drain Node     |
                              +------------------+   +-------------------+
Real Incident Walkthrough: The Intermittent 502 Ghost
Here is how this playbook works in practice during a real incident:
- Symptom: Users report intermittent
502 Bad Gatewayerrors on the checkout service. kubectl logs: Shows clean startup logs and normal 200 responses. No errors logged.kubectl describe: Reveals periodic readiness probe failures:Readiness probe failed: HTTP probe failed with statuscode: 500.kubectl debug: An ephemeralnetshootcontainer is attached to test downstream internal services. Runningdig payment-service.production.svc.cluster.localinside the pod shows intermittent 5-second lookups.tcpdump: Packet captures show UDP DNS requests being sent to CoreDNS, but 1 out of every 10 packets receives no response.journalctlon Worker Node: Checkingjournalctl -u kubeletrevealsconntrack: table full; dropping packet.- Root Cause: The worker node's Linux kernel
conntracktable was exhausted due to a high volume of un-tunneled UDP DNS requests. - Resolution: Enabled local NodeLocal DNSCache and raised
net.netfilter.nf_conntrack_maxon the node pool.
Final Takeaway
kubectl logs is where an investigation begins; it should rarely be where it ends.
When logs go dark, systematically step down the abstraction layers:
- Control Plane:
kubectl describeandevents - Container Level:
kubectl debugwith ephemeral tools - Node Level:
crictlandjournalctl - Kernel / Network:
nsenter,strace,tcpdump, andeBPF
Mastering this progression is what separates basic container troubleshooting from true production engineering.