Databricks Wants Developers to See the Cost of Their Infrastructure
Cloud cost shouldn't be an end-of-month surprise. Discover how connecting Backstage developer portals with Databricks billing data via Lakehouse Federation brings FinOps directly into platform engineering workflows and ephemeral environments.
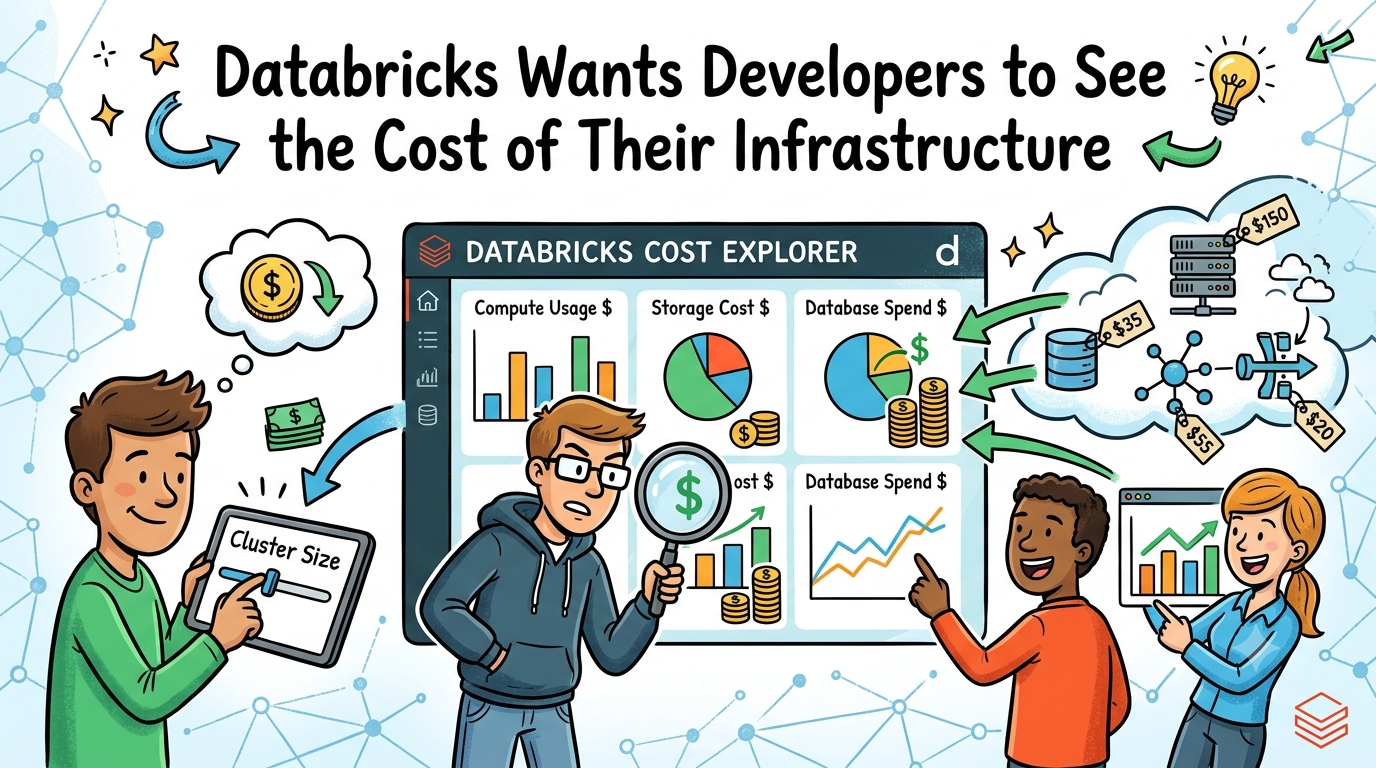
Your monthly cloud bill shows that a specific database cluster cost $4,200 last month.
The FinOps team knows the dollar amount. The platform team knows which Kubernetes cluster is hosting the pod. The software engineer knows which microservice relies on that database.
Yet, connecting those three pieces of information usually requires tag enforcement policies, quarterly spreadsheets, custom ETL scripts, and a surprising amount of detective work.
That friction points to a fundamental gap in modern infrastructure: operational metadata and financial data live in completely isolated worlds.
Databricks has been experimenting with bridging this gap. By federating operational databases such as Backstage's PostgreSQL backend directly with internal billing datasets inside the Lakehouse, developers can query service ownership alongside live infrastructure costs.
It is a subtle shift, but one that could fundamentally alter how platform engineering teams handle FinOps.
The Architectural Disconnect: Service Portals vs. Cloud Bills
In most engineering organizations, software ownership and cloud spending operate on separate data tracks:
[ Developer Portal / Backstage ]
       │
       ├── Service Name: checkout-api
       ├── Owner: Team Payments
       └── Repository: github.com/org/checkout
             │
             │   (Disconnected Data Sets)
             ▼
[ Cloud Billing / Cost Explorer ]
       │
       ├── Resource ID: vol-0a91f82b3c
       ├── Usage: 1,420 Hours
       └── Cost: $3,840.12
When an engineer opens an Internal Developer Portal (IDP) like Backstage, they see repository links, API documentation, health checks, and deployment statuses. They rarely see what that specific service costs to run.
Conversely, when the finance or FinOps team opens a cloud management dashboard, they see aggregated line items attached to raw cloud resource IDs. To map those resource IDs back to Team Payments or checkout-api, someone has to write custom scraping scripts, maintain complex tagging strategies, or manually reconcile datasets.
When tags are missing or incorrectly formatted, which happens regularly in fast-moving engineering teams, the link breaks completely.
Joining Operational Data with Financial Data
Instead of building a traditional ETL pipeline to extract data from operational tools, transform it, and load it into a centralized cost warehouse, the Databricks approach leverages Lakehouse Federation.
Through Lakehouse Federation, the platform queries external operational databases directly from the Lakehouse engine without moving the underlying data.
  [ Backstage PostgreSQL ]                     [ Databricks System Tables ]
(Service Ownership & Metadata)                     (Raw Billing & DBUs)
              │                                              │
              └───────────────┐              ┌───────────────┘
                              ▼              ▼
                     [ Lakehouse Federation Engine ]
                                     │
                                     ▼
                    Unified Cost & Ownership Query
By establishing a federated connection to the PostgreSQL database backing an IDP like Backstage, you can write standard SQL joins that combine:
- Operational metadata: Service name, owner, repository, environment, and team contacts.
- Financial data: Databricks Unit (DBU) consumption, compute instances, storage tiers, and serverless costs.
A single query can immediately answer: "How much did Team Payments spend on ephemeral test environments during the last sprint?"
Ephemeral Infrastructure Shouldn't Mean Invisible Costs
This unified data model becomes especially compelling when managing ephemeral environments.
Modern CI/CD pipelines spun up by platform teams create short-lived infrastructure continuously:
Pull Request #342 Opened
       │
       ├──> Spins up temporary Kubernetes namespace
       ├──> Clones ephemeral database branch
       ├──> Runs integration & end-to-end tests
       │
Pull Request Merged ──> Environment Deleted
Traditional FinOps reporting is terrible at capturing the cost of ephemeral workloads. Because cloud billing reports are often delayed by hours or days, an ephemeral database branch that lived for 45 minutes might appear as an isolated, cryptic line item on a monthly invoice long after the pull request was merged and forgotten.
In proof-of-concept demonstrations connecting operational state with billing tables, ephemeral resources like lightweight, temporary database branches can be tracked down to fraction-of-a-cent consumption metrics (e.g., attributing 0.0107 DBU directly to a specific PR branch ID).
When ephemeral infrastructure cost is linked to the PR or branch metadata that triggered it, platform teams can spot runaway testing loops before they turn into end-of-month invoice surprises.
What This Means for Platform Engineering
Platform engineering is about reducing cognitive load for developers while maintaining operational guardrails.
If FinOps is treated as a separate, monthly auditing process led by finance, developers view cost optimization as an annoying interruption. But if cost metrics are baked natively into the developer portal alongside health probes and deployment logs, cost becomes just another engineering vector like memory usage or API latency.
Imagine a Backstage service card updated in real time:
Service: checkout-api
Owner: Payments Team
Status: Healthy (200 OK)

------------------------------------------------
Monthly Operational Cost: $3,842.00
  ├── Production Compute:  $3,150.00
  ├── Staging Environment:   $480.00
  └── Ephemeral PR Testing:  $212.00 (Last 30 Days)
------------------------------------------------
This transforms FinOps from a reactive audit into an inline developer workflow.
Why DevOps and SRE Teams Should Care
- Precision Right-Sizing: Instead of looking at generic CPU utilization metrics, engineers can evaluate performance against direct dollar impact.
- Zombie Resource Cleanup: Easily identify abandoned staging environments or forgotten preview branches that continue accruing storage charges.
- Architectural Cost Comparisons: Evaluate whether migrating a workload to serverless or tuning a cluster configuration actually yielded savings without relying on estimated calculators.
- Contextual Accountability: Give engineering leads clear visibility into their team's infrastructure footprint without forcing them to navigate raw cloud billing consoles.
The Catch: Technical & Operational Realities
While federating operational data directly into billing engines is architecturally elegant, implementing it in production comes with real-world tradeoffs:
1. Authentication & Security Boundaries
In many proof-of-concept architectures, connecting Lakehouse Federation to an operational database like PostgreSQL requires static credentials (username/password). However, modern developer platforms and cloud-native databases increasingly rely on OAuth or short-lived JWT tokens. Managing these mismatched authentication paths introduces security overhead and credential rotation challenges.
2. Query Latency & Load
Federating live queries across operational production databases (like a live Backstage PostgreSQL instance) can introduce latency or unnecessary load. Platform teams must carefully manage caching strategies or r to prevent analytical cost queries from impacting developer portal responsiveness.
3. Governance & RBAC Complexity
FinOps data is sensitive. Merging developer ownership data with financial data requires fine-grained Role-Based Access Control (RBAC). You must ensure developers only see cost metrics relevant to their scope without exposing broader organizational billing details.
Is FinOps Becoming a Core Developer Feature?
Historically, software development followed a rigid linear flow:
Developers Write Code ──> Operations Deploys ──> FinOps Reviews the Bill
Modern platform engineering collapses these silos into a single feedback loop:
                      ┌──────────────────────┐
                      │  Internal Developer  │
                      │     Portal (IDP)     │
                      └──────────┬───────────┘
                                 │
           ┌─────────────────────┼─────────────────────┐
           ▼                     ▼                     ▼
     [ Code State ]     [ Operational State ]   [ Cost Metrics ]
FinOps shouldn't be an afterthought triggered by a high invoice. Cost is an architecture metric. When platform tools bring billing datasets directly to the place where engineers design, build, and deploy software, cost optimization stops being a monthly lecture from finance and becomes a standard engineering practice.
Millisecond Execution & Workflow Comparison
| Capability | Traditional FinOps Approach | Platform-Integrated FinOps |
| Data Mapping | Manual tags, spreadsheets, and custom scheduled ETL pipelines. | Direct federated SQL joins between IDP databases and billing tables. |
| Ephemeral Resources | Hard to track; often aggregated into generic unallocated line items. | Attributed directly to specific PRs, branches, or temporary namespaces. |
| Developer Context | Isolated inside third-party SaaS tools or cloud billing consoles. | Rendered natively alongside service health metrics inside Backstage. |
| Feedback Loop | Reactive (End-of-month invoice review). | Proactive (Daily operational visibility). |
Practical Takeaway for Platform Teams
The value of Databricks' approach isn't simply that you can connect two database endpoints together. It is the architectural direction it represents.
Application metadata, infrastructure topology, and cloud spending are converging into a unified observability domain. For platform teams building internal developer portals, the goal is clear: a developer should never have to leave their primary workflow to understand what their application costs to run.