AI-Powered Observability for Predictive Root Cause Analysis in DevOps
Demystify AI-powered observability and predictive root cause analysis (RCA). Learn how combining OpenTelemetry, anomaly detection, and causal AI reduces MTTR and alert fatigue for DevOps & SRE teams.
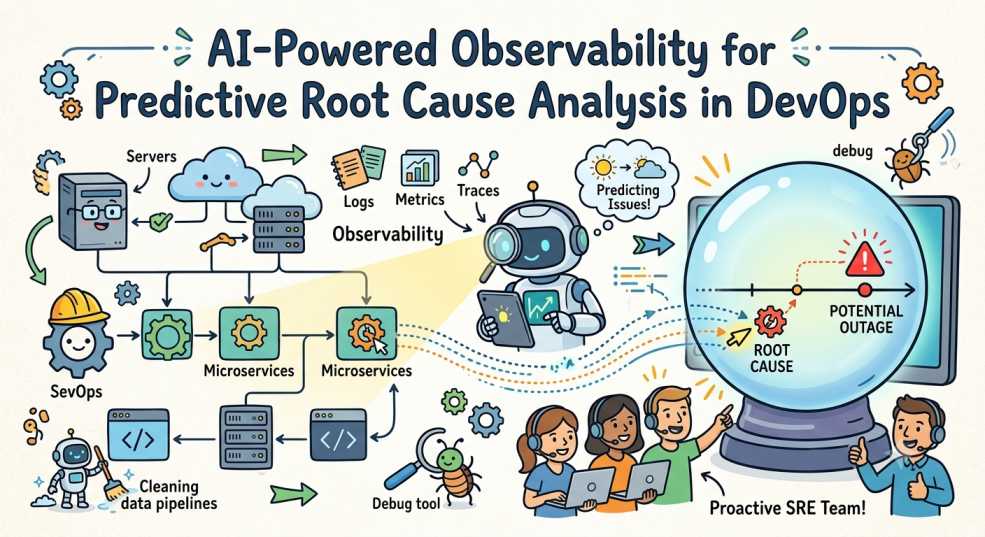
Welcome to DevOps Inside, where we break things so you can scale them safely (and smile while doing it).
Today we're going to demystify how AI-powered observability can transform root cause analysis (RCA) from frantic midnight detective work into a calmer, more predictive process. Yes, predictive RCA. Think fewer pages at 2 AM and more time for pizza. 🍕
Why Predictive Root Cause Analysis Matters (and why humans cheer)
Traditional RCA is reactive: something breaks, alarms blare, humans scramble, blame is avoided, and systems recover. Predictive RCA flips the script by using machine learning, anomaly detection, causal analysis, and AI-assisted reasoning to identify signals that may point to an incident before they become full-blown outages.
Business wins:
- Reduced mean time to detect (MTTD) and mean time to repair (MTTR)
- Fewer unnecessary pages, happier on-call rotations
- Improved customer experience and fewer late-night demos going wrong
What Is AI-Powered Observability?
Observability is the art of using telemetry to infer what a system is doing. Add modern AI, predictive analytics, causal analysis, and GenAI co-pilots, and observability becomes:
- Predictive: Identifies patterns that may indicate issues before they affect SLOs.
- Contextual: Correlates signals across layers such as application, infrastructure, network, eBPF data, and configuration changes.
- Actionable: Suggests likely root causes and verified remediation steps.
In short, AI-powered observability combines system telemetry with anomaly detection, correlation, and AI-assisted analysis to help teams investigate incidents faster. 🧠
Core Signals AI Uses
- Metrics: CPU, latency, error rates, saturation, and custom application counters.
- Logs: Structured and unstructured logs parsed into events, exceptions, or anomalous patterns.
- Traces: Distributed traces showing request flows, spans, and microservice latencies.
- Profiles: Continuous profiling data that can help pinpoint CPU, memory, and code-level bottlenecks. OpenTelemetry Profiles is currently an Alpha signal, while eBPF-based profilers are one approach to collecting profiling data.
- Topology & Dependency Data: Real-time service maps, pod-to-node relationships, and API dependency graphs.
- Events & Incidents: CI/CD deployments, feature flags, configuration changes, alerts, and external vendor status signals.
OpenTelemetry currently provides stable core signals for traces, metrics, and logs, while Profiles is still under development and currently at Alpha maturity.
How Predictive RCA Actually Works: A Friendly Walkthrough
Let’s walk through a simplified flow like you’re watching a detective show, but with less dramatic music and more elegant graphs. 🎬
1) Data ingestion and normalization
Telemetry streams in from your systems using standards like OpenTelemetry (OTel) into a central observability platform. This data is cleaned, timestamp-aligned, and enriched with metadata such as service name, region, Git commit, deployment ID, and environment.
AI loves structured, high-quality input, so feeding it clean and consistent telemetry makes a huge difference. OpenTelemetry Semantic Conventions provide common naming and attribute conventions that make telemetry easier to correlate and consume across systems.
2) Baselining and anomaly detection
Models learn normal behavior per service and per metric. When something deviates, anomaly detectors flag it. Unlike simple threshold alerts, these models can account for changing traffic patterns and seasonality, reducing alerts caused by predictable behavior.
3) Correlation, causal analysis, and AI reasoning
This is where predictive RCA becomes useful. Instead of simply listing everything that changed, the system looks for relationships between anomalies, dependencies, deployments, and system events.
Depending on the platform, this can involve:
- Time-series analysis: Change-point detection and temporal relationships can help identify signals that consistently appear before another event. These relationships should be treated as evidence, not automatic proof of causation.
- Dependency graphs: Service and infrastructure relationships can help narrow the search to components that could realistically influence the affected service.
- GenAI and LLM reasoning: AI can analyze trace spans, error messages, stack traces, configuration changes, and commit diffs together to provide additional context.
The result can be a ranked set of likely root causes with supporting evidence and confidence levels rather than simply a noisy collection of correlated metrics.
4) Enrichment and recommendations
AI augments findings with playbook links, relevant logs, distributed traces, and commit diffs, giving you the "why" plus the "how." Depending on the platform and its integrations, it might even suggest remediation steps such as rolling back a deployment, scaling a cluster, restarting a pod, or executing an automated runbook.
The important part is that recommendations should be validated against your environment and policies before high-impact actions are executed.
5) Feedback loop and continual improvement
Human validation can help improve incident workflows, detection rules, recommendations, and system-specific models over time. For example, engineers can confirm whether a suggested root cause was useful or mark a recommendation as incorrect.
This human-in-the-loop approach keeps the system grounded in actual operational experience rather than assuming every AI-generated conclusion is correct. 🙅♂️
Benefits for DevOps, SRE, and Platform Teams
- Faster RCA: Narrow the root cause to the top candidates in minutes, not hours.
- Proactive Detection: Identify signals of potential issues before they affect customers or SLOs.
- Reduced Alert Fatigue: Smarter alerts enriched with context and confidence levels.
- Autonomy for Less Risky Fixes: Automate safe, reversible remediation while keeping humans in the loop for complex decisions.
- Better Post-Incident Analysis: Rich causal graphs and event timelines make blameless postmortems more insightful.
Real-World Examples: Short Stories from the Trenches
Example 1: The stealthy memory leak
A microservice slowly leaks memory across a subset of Kubernetes pods. Metrics look noisy, and alerts are intermittent.
The observability system spots a growing memory trend and correlates it with profiling data, GC pauses, and a recent dependency update. It points the team toward the new library version, highlights relevant stack traces, and recommends investigating or rolling back the deployment.
The team rolls back, and the problem is resolved before it becomes a larger customer-facing incident. 🎯
Example 2: The intermittent latency spike
Latency spikes every hour. Manual digging points to many suspects. AI correlates the spikes with external API calls and network telemetry, showing that a third-party provider is occasionally slowing down requests.
The platform suggests investigating a circuit breaker and caching strategy. The team can then validate the evidence and decide on the appropriate fix.
Common Pitfalls and How to Avoid Them
- Poor Telemetry Quality: Garbage in, garbage out. Standardize on OpenTelemetry, use consistent attributes and semantic conventions, manage high-cardinality data carefully, and keep timestamps synchronized.
- Black-Box Models: Teams distrust opaque suggestions. Prioritize explainability and look for tools that show why a cause was selected and what evidence supports it.
- Over-Automation: Automated remediation is tempting. Start small and automate safe, reversible actions first. What is considered low-risk will depend on your environment.
- Ignoring Feedback: If engineers don't validate or correct AI findings, incorrect recommendations can continue to appear. Integrate feedback into your incident workflows.
- Too Much Telemetry: More data does not automatically mean better RCA. Poorly selected or extremely high-cardinality telemetry can increase storage and query costs without improving the investigation.
Practical Steps to Adopt Predictive RCA
Ready to bring AI-powered observability into your org? Here's a pragmatic roadmap:
- Inventory Telemetry: Catalog metrics, logs, traces, profiles, and deployment events across services.
- Fix Data Hygiene: Adopt OpenTelemetry Semantic Conventions, standardize names and attributes, and ensure synchronized clocks.
- Start with a Pilot: Pick a critical microservice with frequent changes and clear SLOs.
- Integrate with Tools: Hook AI observability into your incident stack, ChatOps, CI/CD pipelines, and GitOps workflows.
- Measure Impact: Track MTTD, MTTR, unnecessary pages, false-positive rates, and the quality of RCA recommendations.
- Iterate and Expand: Grow coverage across services and automate low-risk remediations as confidence in the workflow increases.
Choosing the Right Tooling
There are several observability platforms, AIOps platforms, and open-source building blocks available. When evaluating tools, look for:
- Native OpenTelemetry and eBPF support across logs, metrics, traces, and profiling
- Explainable AI outputs and clear confidence or evidence indicators
- Seamless integration with incident tools, CI/CD pipelines, and ChatOps workflows
- Support for human-in-the-loop feedback
- Predictable cost controls and transparent pricing for high-cardinality data
Pro tip: Proof-of-value matters more than feature lists. A short, focused pilot that reduces MTTR on a real incident is far more persuasive than a long RFP process.
Final Thoughts: AI as Your Co-Pilot, Not a Crystal Ball
AI-powered observability and predictive RCA aren't about replacing engineers. They're about amplifying human judgment, reducing toil, and getting you home earlier.
Think of AI as your observability co-pilot: it points you toward the most likely path to the problem, hands you the evidence and checklist, and helps you investigate faster.
There will still be surprises, but with better telemetry, smarter analysis, and human feedback, you'll handle incidents faster, learn more from them, and sleep better at night.
If you'd like more hands-on guides, tools, and templates for adopting predictive RCA, swing by DevOps Inside. We've got your back.
Want a quick checklist to take away?
- Inventory telemetry and enforce OpenTelemetry attribute and Semantic Convention hygiene
- Baseline normal behavior and deploy a pilot on a high-velocity service
- Use explainable analysis and human-in-the-loop validation
- Automate safe, reversible remediations first
- Measure MTTD and MTTR impact and iterate
Happy monitoring, and may your alerts be meaningful and your nights restful! 🌙