Building Your Own Internal DevOps AI Assistant Using MCP and LLMs
Build an internal DevOps AI assistant using MCP, LLMs, Kubernetes, GitHub, Prometheus, Grafana, and vector databases. Learn how platform engineering teams accelerate incident response with AI-powered context retrieval and infrastructure-aware automation.
It's 2:17 AM.
PagerDuty wakes you up because the checkout service is failing in production. Within minutes, you're jumping between Grafana dashboards, Prometheus queries, Kubernetes events, GitHub commits, Slack conversations, and application logs, trying to answer one simple question:
What changed?
Every tool provides part of the story, but none of them provide the complete picture. You spend more time collecting information than actually solving the incident.
Now imagine a different workflow.
You open Slack and ask:
Why is the checkout service failing?
A few seconds later, your internal AI assistant replies:
"The latest deployment introduced a ConfigMap change 14 minutes ago. Pods are failing readiness probes because theDATABASE_URLenvironment variable is missing. Error rates increased immediately after commit7c91b2e. Rolling back the deployment should restore service."
No searching through dashboards.
No switching between browser tabs.
No manual correlation of metrics, logs, and Git history.
The AI already gathered the context before answering.
This isn't science fiction anymore. It's exactly what many engineering teams are beginning to build. Rather than using AI as a general-purpose chatbot, they're turning it into an engineering assistant that understands their infrastructure, deployment history, observability stack, and internal documentation.
The result isn't simply better answers. It's faster incident response, fewer repetitive tasks, and more time spent solving problems instead of gathering evidence.
Why Public AI Isn't Enough
Modern AI models like ChatGPT, Claude, and Gemini are remarkably capable. They understand Kubernetes, Terraform, Docker, Linux, cloud architecture, and hundreds of other technologies.
But they all share one major limitation.
They know almost nothing about your environment.
They don't know:
- What your Kubernetes cluster looks like
- Which services communicate with each other
- What changed in yesterday's deployment
- Which Grafana dashboard your SRE team relies on
- Why a production alert fired five minutes ago
- What your incident runbooks recommend
Without that context, AI can only make educated guesses.
Suppose you ask:
Why are my Kubernetes pods restarting?
A public AI model will usually respond with a list of common causes such as memory limits, failed probes, application crashes, or missing environment variables. Those suggestions aren't wrong, but they aren't specific to your cluster either.
Now imagine asking the same question while allowing AI to access:
- Your Kubernetes API
- Recent deployment history
- Pod events
- Application logs
- Prometheus metrics
- Grafana dashboards
- Internal runbooks
Instead of guessing, it can identify the actual root cause.
The question didn't change.
The context did.
That's why internal AI assistants are becoming increasingly valuable. They don't replace public AI models. They extend them with the operational knowledge your organization already has.
The Architecture of an Internal DevOps AI Assistant
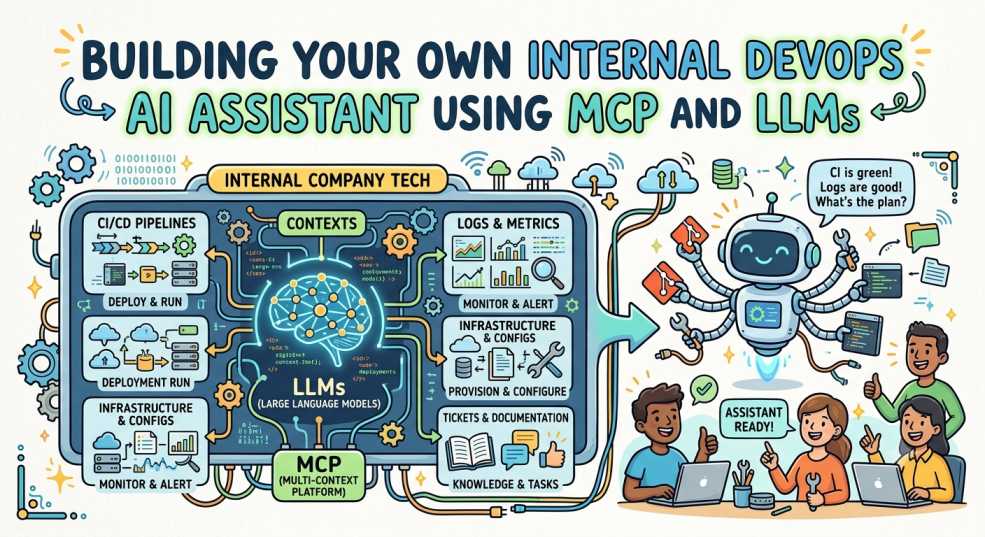
At a high level, an internal DevOps AI assistant acts as a bridge between engineers, infrastructure, and an LLM.
Instead of relying only on the prompt, it retrieves information from multiple systems before generating a response.
The architecture looks like this:
| Engineer | ||||||
| ↓ | ||||||
| Slack / Teams / CLI | ||||||
| ↓ | ||||||
| MCP Server | ||||||
|
||||||
| ↓ | ||||||
| Large Language Model | ||||||
| ↓ | ||||||
| Actionable Response |
Every component has a specific role.
The chat interface is where engineers interact with the assistant.
The MCP server retrieves information from different systems.
Infrastructure tools provide operational context.
The LLM reasons over that information and generates an answer grounded in real data rather than assumptions.
Unlike traditional chatbots, the model isn't expected to know everything beforehand. It gathers the information it needs before responding.
The Chat Interface Should Live Where Engineers Already Work
One of the biggest mistakes organizations make is building another dashboard.
Engineers already spend their day switching between monitoring tools, CI/CD pipelines, ticketing systems, cloud consoles, and collaboration platforms. Adding another interface only increases that cognitive load.
A better approach is to bring the AI assistant into tools engineers already use.
Common options include:
- Slack
- Microsoft Teams
- VS Code
- Cursor
- Claude Code
- Command-line interfaces
- Internal developer portals
Imagine an engineer typing:
"Show me why the payment API latency increased after today's deployment."
Or:
"Which services are consuming the most CPU right now?"
Or:
"Summarize everything that changed in production today."
Instead of opening multiple dashboards, the engineer receives a single response backed by data collected from across the platform.
The assistant becomes another member of the team rather than another application to manage.
MCP Becomes the Brain of the System
Connecting an AI model to infrastructure used to require custom integrations for every tool.
One connector for GitHub.
Another for Kubernetes.
Another for Grafana.
Another for Prometheus.
Maintaining those integrations quickly became difficult as the number of tools increased.
This is where the Model Context Protocol (MCP) changes the architecture.
MCP provides a standard way for AI assistants to communicate with external systems. Instead of building custom integrations for every model, engineers expose data through MCP servers that AI clients can query when they need additional context.
Without MCP, the workflow usually looks like this:
Engineer → Prompt → LLM → GuessWith MCP, it becomes:
Engineer → Prompt → MCP → Infrastructure → LLM → Evidence-Based AnswerThat difference is enormous.
Rather than relying only on information contained in the prompt, the AI can retrieve live Kubernetes resources, deployment history, metrics, dashboards, documentation, or incident reports before generating a response.
In other words, MCP doesn't make the model smarter.
It makes the model better informed.
And for infrastructure troubleshooting, having the right information is often more valuable than having a larger model.
GitHub Gives AI the Missing Piece Every Incident Needs
One of the first questions experienced SREs ask during an outage is surprisingly simple:
"What changed?"
Production systems rarely fail without a trigger. A deployment is updated, a ConfigMap changes, a Helm chart is modified, or a seemingly harmless pull request introduces an unexpected side effect.
GitHub already contains that history.
When your AI assistant can access your repositories, it stops treating every incident as an isolated event. Instead, it can correlate production issues with recent changes and immediately narrow the investigation.
For example, instead of simply reporting that a deployment is unhealthy, the assistant could respond with:
"The checkout service started failing nine minutes after PR #482 was merged. That PR updated the database connection settings and introduced a new readiness probe."
That's far more valuable than listing generic troubleshooting steps.
Beyond debugging, GitHub also enables AI to answer questions like:
- Which deployment introduced this issue?
- Who last modified this manifest?
- Which services were updated today?
- Has this file changed before?
- Which pull request introduced this configuration?
By combining deployment history with live infrastructure data, AI can move from reacting to incidents to explaining why they happened.
Prometheus Gives AI Real-Time Metrics
Configuration tells AI how your infrastructure is supposed to behave.
Metrics tell it how it's behaving right now.
This is where Prometheus becomes one of the most valuable context sources.
Instead of relying on assumptions, the assistant can retrieve live metrics such as:
- CPU utilisation
- Memory consumption
- Request latency
- Error rates
- Disk I/O
- Network traffic
- Pod restarts
- API response times
Imagine asking:
Why is the payment service slow?
Without metrics, the AI can only speculate.
With Prometheus, it might discover that CPU usage is stable, memory consumption hasn't changed, but request latency and error rates began increasing immediately after a deployment.
That instantly shifts the investigation away from infrastructure capacity and toward application behaviour.
Metrics transform vague troubleshooting into evidence-based analysis.
Grafana Provides the Bigger Picture
Prometheus collects numbers.
Grafana helps explain what those numbers mean.
Dashboards allow engineers to observe relationships that are difficult to spot from individual metrics alone. CPU, memory, request latency, deployment annotations, and error rates can all be viewed together on a single timeline.
When an AI assistant can access Grafana dashboards, it gains the same high-level perspective engineers rely on during incidents.
Instead of answering with isolated statistics, it can identify patterns such as:
- Latency increased immediately after today's deployment.
- Error rates rose while CPU usage remained stable.
- Database response time increased before application latency.
- Traffic doubled shortly before the first alerts appeared.
Those relationships are often more valuable than the raw numbers themselves.
Grafana gives AI context, not just data.
The Kubernetes API Shows What's Happening Right Now
GitHub explains what changed.
Prometheus explains how the system is performing.
The Kubernetes API explains what the cluster is doing at this moment.
Rather than asking engineers to copy and paste kubectl output, an internal assistant can retrieve information directly from the cluster.
That includes resources such as:
- Pods
- Deployments
- ReplicaSets
- Services
- Namespaces
- Nodes
- Events
- ConfigMaps
- Secrets
- Ingress resources
It can also inspect:
- Pod status
- Restart counts
- Scheduling failures
- Readiness and liveness probes
- Recent events
- Resource requests and limits
Imagine asking:
Why isn't the checkout deployment becoming ready?
Instead of asking you to provide logs, the assistant could automatically inspect the Deployment, retrieve pod events, examine the failing readiness probe, review recent rollouts, and identify the underlying issue.
The engineer spends less time gathering evidence and more time deciding how to fix the problem.
A Vector Database Gives AI Long-Term Memory
Infrastructure data explains what's happening now.
A vector database helps explain what's happened before.
Most engineering organisations already have thousands of pages of valuable documentation:
- Runbooks
- Architecture diagrams
- Incident postmortems
- Internal documentation
- Operational guides
- Troubleshooting notes
The problem isn't that the information doesn't exist.
It's that nobody remembers where it is.
Traditional search relies on matching keywords.
Vector databases search for meaning.
That means an engineer could ask:
"Have we seen this Kubernetes networking issue before?"
Even if those exact words never appeared in a previous incident report, the assistant can retrieve similar postmortems because the underlying concepts are related.
This makes historical knowledge immediately useful during production incidents.
Instead of solving the same problem twice, engineers can build on everything the organisation has already learned.
Bringing Everything Together
Each of these systems solves a different part of the puzzle.
GitHub explains what changed.
Prometheus measures how the system is behaving.
Grafana reveals relationships between metrics.
Kubernetes shows the current cluster state.
A vector database contributes historical knowledge and documentation.
An LLM then combines all of that information into a single response that would otherwise require an engineer to manually investigate multiple tools.
The complete workflow looks like this:
| Engineer asks a question | ||||||
| ↓ | ||||||
| MCP retrieves context | ||||||
| ↓ | ||||||
|
||||||
| ↓ | ||||||
| LLM reasons over the evidence | ||||||
| ↓ | ||||||
| Actionable answer |
The assistant isn't replacing engineers.
It's replacing the repetitive work of collecting information from six different systems before the real troubleshooting can even begin.
A Real Production Example
To understand how all these components work together, let's walk through a realistic production incident.
An engineer receives an alert that the checkout service is returning a high number of 500 errors. Instead of opening multiple dashboards and running several kubectl commands, they ask the internal AI assistant:
Why is the checkout service failing in production?
Behind the scenes, the assistant doesn't immediately generate an answer. It first collects evidence.
It retrieves the latest deployment from GitHub, checks Kubernetes events for failing pods, queries Prometheus for CPU, memory, latency, and error-rate metrics, opens the relevant Grafana dashboard, searches previous incident reports in the vector database, and finally sends all of that context to the language model.
A few seconds later, the response might look something like this:
Root cause identified.
The latest deployment introduced a ConfigMap change that removed theDATABASE_URLenvironment variable.
Pods are repeatedly failing their readiness probes because the application cannot establish a database connection.
Error rates increased immediately after commit7c91b2e, and a similar incident occurred three months ago after a configuration change to the same service.
Rolling back the deployment or restoring the missing environment variable should resolve the issue.
Notice what happened.
The AI didn't magically know the answer.
It investigated the environment the same way an experienced platform engineer would. The only difference is that it completed the investigation in seconds instead of requiring someone to manually search across multiple systems.
That's the real value of an internal AI assistant. It reduces the time spent collecting information so engineers can focus on solving the problem.
Challenges You'll Need to Solve
Building an internal AI assistant isn't simply a matter of connecting an LLM to Kubernetes. Production environments introduce challenges that every engineering team needs to consider.
Security is usually the first concern.
Your AI may have access to deployment manifests, infrastructure documentation, incident reports, and monitoring systems. That doesn't mean every engineer should automatically have access to everything. The assistant should respect the same permissions and access controls already enforced across your organization.
Another challenge is hallucinations.
Even with access to infrastructure, an LLM can still make incorrect assumptions or misunderstand incomplete data. For that reason, AI should provide supporting evidence alongside its recommendations rather than asking engineers to trust the answer blindly.
There's also the question of latency.
Every request may involve querying Kubernetes, GitHub, Prometheus, Grafana, and a vector database before the model can generate a response. Poorly designed retrieval pipelines can become slower than the manual investigation they're supposed to replace.
Finally, consider cost.
Large language models aren't free, and continuously sending huge amounts of logs, metrics, and documentation quickly increases token usage. Good context engineering focuses on retrieving only the information needed to answer the current question.
Like any production system, an internal AI assistant should be designed for reliability, security, and efficiency rather than convenience alone.
Best Practices
Building an AI assistant is relatively straightforward.
Building one that engineers actually trust is much harder.
A few principles consistently lead to better results:
- Start with read-only access before introducing automation.
- Use MCP wherever possible instead of maintaining custom integrations.
- Retrieve only the context required for the current task.
- Store runbooks, postmortems, and documentation in a vector database.
- Connect AI to observability platforms, not just source code.
- Keep permission models consistent with your existing RBAC policies.
- Log every AI request and response for auditing and debugging.
- Require AI to explain why it reached a conclusion, not just what it recommends.
- Treat AI as an assistant that supports engineers rather than a system that makes production decisions independently.
The most successful teams aren't replacing engineers with AI.
They're removing repetitive investigation work so engineers can spend more time solving complex problems.
From Prompt Engineering to Context Engineering
If you've read our previous article on AI Context Engineering for DevOps, you'll notice a common theme.
Prompt engineering focuses on asking better questions.
Context engineering focuses on providing better information.
An internal DevOps AI assistant is simply the next step in that evolution.
Instead of expecting engineers to manually gather logs, dashboards, manifests, Git history, and documentation, the assistant retrieves that context automatically before the language model begins reasoning.
In other words, it automates one of the most time-consuming parts of incident response.
That's what transforms AI from a chatbot into an engineering assistant.
Conclusion
The future of DevOps AI isn't about replacing platform engineers or automating every operational decision.
It's about eliminating the repetitive work that slows engineers down.
Every production incident begins with the same challenge: collecting enough information to understand what's happening. Logs live in one system, metrics in another, deployments somewhere else, and documentation somewhere else again. Engineers spend valuable time stitching those pieces together before they can even begin troubleshooting.
An internal AI assistant changes that workflow.
By combining MCP, Kubernetes, GitHub, Prometheus, Grafana, vector databases, and a large language model, it can gather context automatically and present engineers with evidence instead of assumptions.
The model itself isn't the most important part of the system.
The context is.
Because in modern DevOps, the most valuable AI isn't the one that knows the most.
It's the one that understands your infrastructure.
"The best DevOps AI isn't the one with the biggest model. It's the one with the deepest understanding of your infrastructure."