Beyond DORA Metrics: What Should DevOps Teams Measure Now? [2026 Guide]
DORA metrics aren't enough in 2026. Discover how to measure developer flow, platform effectiveness, AI productivity, and rework to truly understand your engineering system's health.
![Beyond DORA Metrics: What Should DevOps Teams Measure Now? [2026 Guide]](/content/images/size/w2000/2026/09/Beyond-Dora-Metrics-What-should-DevOps-Teams-Measure-now-1.jpg)
DORA metrics still matter. But here at DevOps Inside, we know that in 2026, measuring how fast you ship and how often things break is no longer enough to understand the health of an engineering organization.
Your team deployed 40% more often this quarter.
Lead time went down.
Change failure rate improved.
Recovery got faster.
The DORA dashboard is green.
So why does everyone still feel like engineering is getting slower?
That is the uncomfortable question.
DORA metrics have become one of the most recognizable ways to measure software delivery performance. They give engineering teams a common language for discussing deployment frequency, change lead time, failed deployment recovery time, change failure rate, and deployment rework rate. The framework has also evolved, moving from its original four metrics to a five-metric model by adding deployment rework rate to make unplanned production work more visible.
But software delivery has changed too.
Platform engineering is now common. AI coding tools are producing code at a pace developers could not previously match. CI/CD pipelines are more sophisticated. Kubernetes and cloud platforms have moved infrastructure closer to developers. Observability has become part of the delivery system itself.
And that creates a problem.
We can measure the delivery pipeline extremely well while still having no idea whether the engineering system is actually healthy.
That is where we need to go beyond DORA.
DORA Is Not Dead
Let's get this out of the way first.
DORA is not obsolete. In fact, the framework continues to evolve.
The current DORA model measures five core areas of software delivery performance:
- Deployment frequency: How often changes reach production.
- Change lead time: How long it takes a change to move from commit to successful production deployment.
- Failed deployment recovery time: How quickly the team restores service after a deployment-related failure.
- Change fail rate: How frequently deployments result in production failures.
- Deployment rework rate: How much deployment activity is unplanned work caused by production problems.
DORA currently groups these into throughput and instability. That distinction is useful. The problem starts when organizations turn those metrics into a scoreboard, because the moment a metric becomes a target, people start optimizing for the number. Software systems are exceptionally good at exposing bad incentives.
The Problem With Treating DORA Like a Scoreboard
Imagine a team is told they need to increase deployment frequency, so they start splitting changes into smaller deployments. Frequency goes up. Another team is told to reduce lead time, so they remove an approval step. Lead time goes down. A third team is told to reduce change failure rate, so they become overly conservative about what they deploy. Failure rate goes down.
Every number looks better. But none of those numbers, by themselves, tell you whether developers are spending their time effectively, whether the platform is slowing them down, whether users are happy, or whether engineers are spending half their week fixing problems created by previous changes.
DORA describes these metrics as diagnostic rather than punitive. The point is to identify systemic patterns and improve the delivery system, not rank individual engineers.
Your DORA Dashboard Can Be Green While Your Engineering System Is Broken
Consider a fictional engineering organization.
Before a major platform improvement, they deployed 80 times a month with a 2-day lead time, an 18% change failure rate, and a 3-hour recovery time. Six months later, deployments hit 250 a month, lead time dropped to 3 hours, change failure rate fell to 8%, and recovery time shrank to 35 minutes.
That looks fantastic. Someone is probably preparing the leadership presentation already.
Now add a few metrics that aren't on the DORA dashboard: CI queue times jumped from 5 to 28 minutes, PR review wait times rose from 4 to 19 hours, production rework climbed from 12% to 21%, developer interruptions increased from 6 to 17 per week, and platform-related incidents grew from 3 to 11 per month.
Suddenly the story changes. The organization became better at moving changes through the deployment pipeline, but it didn't necessarily become better at engineering.
Metric 1: Measure Developer Flow
DORA measures the movement of changes through software delivery, but it doesn't tell you everything about the human system producing those changes. A developer can write code in 20 minutes and then wait six hours for a CI pipeline. The deployment system sees a six-hour lead time, but the developer spent most of that time waiting.
To capture this, track the friction points that sit between the commit and the deployment:
- PR review wait time
- CI queue time
- Build and test duration
- Deployment and approval wait time
- Environment provisioning time
- Time spent waiting for other teams or recovering from failed tooling
Developer-flow metrics turn developer experience from a vague survey into a concrete diagnostic signal.
Metric 2: Measure Platform Engineering Effectiveness
Platform teams face a unique paradox: a platform can be technically advanced yet terrible for developers. You can have Kubernetes, GitOps, internal developer portals, and dozens of Terraform modules, but developers will still open support tickets if they don't know which path to take.
The question shouldn't simply be how many platform capabilities were built. It should be whether the platform reduced cognitive load and friction across the entire service lifecycle. Expand your telemetry to include:
- Time to provision an environment and create a new service
- Self-service success rate and golden-path adoption
- Day-2 operations friction: How easily developers can update dependencies, manage secrets, configure monitoring, or decommission services
- Platform-induced deployment failures and manual requests required
If a new self-service environment takes 45 minutes to provision instead of a 10-minute ticket-based process, the platform hasn't improved developer experience; it has just automated the wrong thing.
Metric 3: Measure Reliability From the User's Side
Deployment success is not the same thing as user success. The Kubernetes rollout can be green, the CI pipeline can be clean, and health checks can pass, while users are still experiencing a complete outage.
Engineering teams must connect delivery metrics with reliability and user-impact telemetry:
- SLO attainment and error-budget consumption
- Real-world latency, error rates, and availability
- Customer-impacting incidents and business transactions affected
If Team A deploys 40 times a day with a 5% change failure rate and 99.99% SLO attainment, while Team B deploys 5 times a day with a 2% failure rate and 99.5% SLO attainment, you cannot evaluate their true performance from DORA metrics alone.
Metric 4: AI Changes the Measurement Problem
AI coding assistants and autonomous agents can dramatically accelerate code generation. That sounds like a clear justification to crank up deployment frequency.
However, higher output often brings hidden costs: more code to review, more CI executions, deeper dependency trees, increased security findings, and more rollback candidates. Relying on superficial metrics like raw token consumption or lines of code creates a metric that can be gamed in minutes.
A robust AI measurement strategy focuses on systemic outcomes rather than raw output:
- Code churn: The volume of AI-generated code deleted or heavily rewritten within 7 days of commit
- Pull request rejection or revision rates
- Rework, security vulnerabilities, and defects associated with AI-assisted changes
- Developer-reported usefulness versus actual product outcomes
The goal isn't to measure how much AI developers use; it is to determine whether AI is genuinely improving the engineering system.
Metric 5: Rework Is More Important Than You Think
Modern DORA includes deployment rework rate for a critical reason: raw delivery speed easily hides the amount of engineering effort spent fixing past mistakes.
It is vital to distinguish between change failure rate and deployment rework rate. Change failure rate tracks immediate release failures requiring emergency rollbacks or hotfixes. Deployment rework rate tracks the broader volume of reactive deployment cycles spent patching, reconfiguring, or correcting code that was previously considered done.
If Team A deploys 100 times with 8 rework deployments, and Team B deploys 300 times with 60 rework deployments, Team B has high throughput but is bleeding capacity on reactive maintenance. Don't celebrate throughput without inspecting what lives inside that volume.
Stop Building Giant DevOps Dashboards
When teams realize DORA isn't enough, the knee-jerk reaction is to build a dashboard with 73 metrics, rendering everything unreadable. This is telemetry hoarding, not observability.
Use metrics as a diagnostic decision tree rather than a monitoring wall:
- Deployment frequency dropped? Check PR review time, CI queue time, build duration, and approval bottlenecks.
- Change failure rate increased? Analyze service architecture, deployment strategies, change size, and dependency health.
- Rework increased? Investigate recurring production bugs, configuration drifts, and infrastructure gaps.
- Platform adoption is lagging? Audit onboarding documentation, missing capabilities, and exception-handling workflows.
What a Modern Engineering Scorecard Looks Like
A sustainable measurement model organizes metrics into distinct, complementary layers:
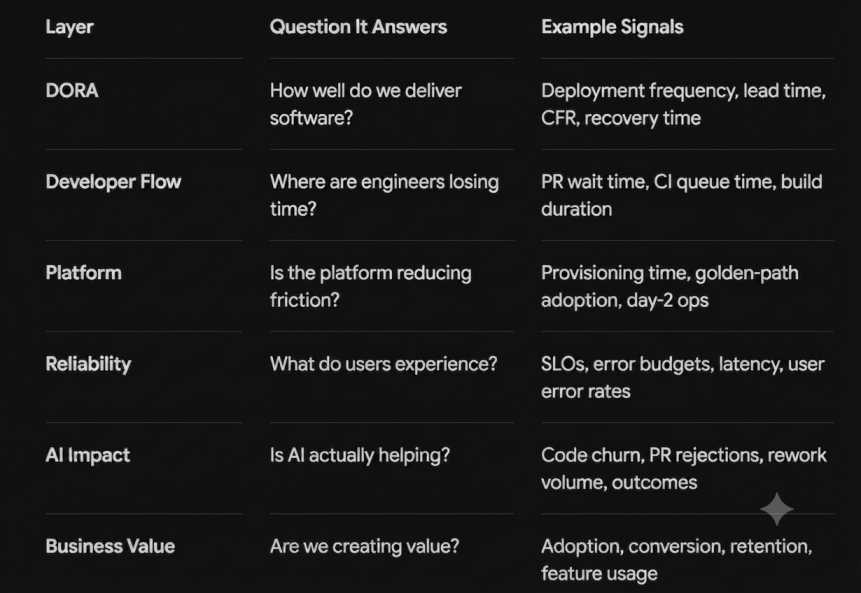
There is no single magic metric at the bottom of this model. Software engineering is an interconnected system, and no single number can describe its absolute health.
Don't Turn These Metrics Into Developer KPIs
Never take metrics like deployment frequency, lead time, or AI-assisted output and turn them into individual developer performance targets. Once engineers believe a number is being used to judge them personally, the metric stops being a window into system health and becomes a game to optimize.
A modern DevOps organization should continuously evaluate five fundamental questions: Can we deliver quickly? Can we deliver safely? Are developers spending time effectively? Is our platform reducing friction? Are we creating real business value?
If you can only answer the first question, you don't have an engineering measurement system; you have a deployment dashboard.
Keep DORA as your high-level delivery baseline, but let your current operational challenges guide your next diagnostic step. The goal was never to make the dashboard green. The goal was to make the engineering system better.
"A dashboard can lie, but a 3 AM page never does."