AI Coding Agent Cost and Token Usage Monitoring with Burn O Meter on Mac
Track AI coding agent token usage, costs, and rate limits locally with Burn-O-Meter. Monitor Claude Code, Codex CLI, and OpenCode across projects and models without cloud telemetry.
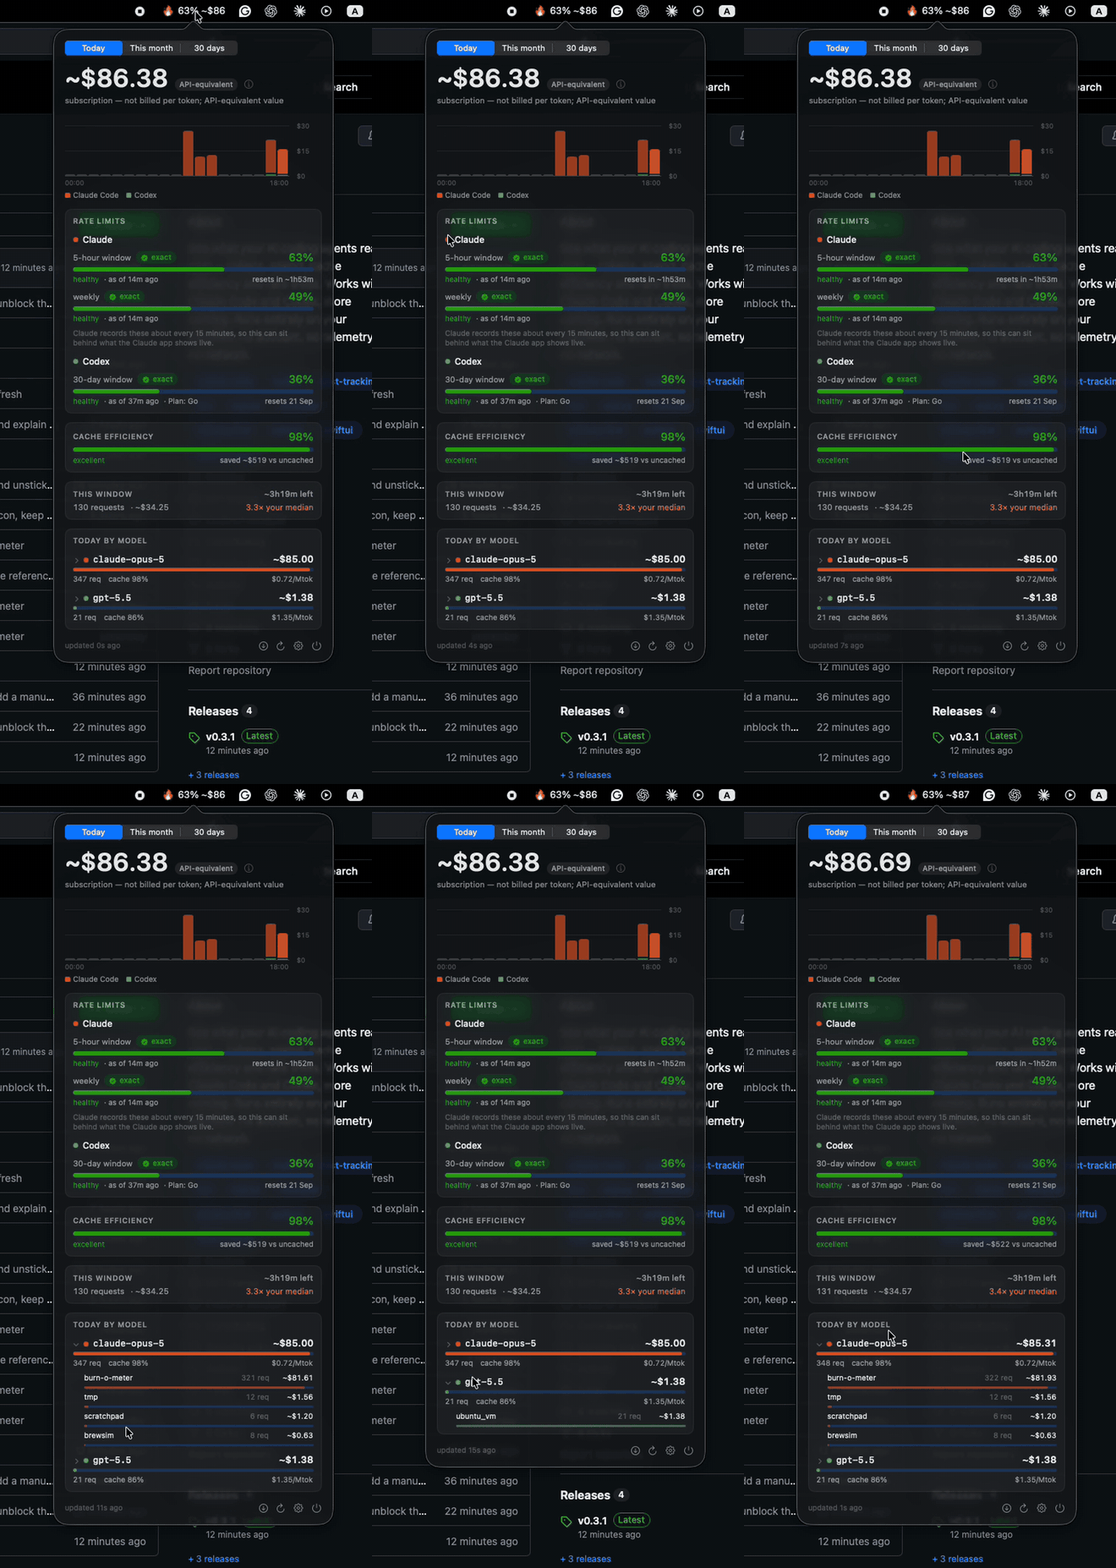
Welcome to DevOps Inside, where we talk about the infrastructure problems that start showing up once developers begin doing things at scale. Today, that problem is not Kubernetes, cloud spend, or another 3 AM production alert. It is AI coding agents.
Claude Code, Codex CLI, OpenCode, and other coding agents can now work through entire repositories, run commands, inspect files, and make multiple model calls while working on a single task. That is incredibly useful, but it also creates a simple question that is surprisingly difficult to answer:
How much are all these AI coding agents actually using?
You can look at individual provider dashboards, but once you use more than one agent, the picture becomes fragmented. One tool knows about its own usage, another knows about its own usage, and you are left trying to put everything together yourself.
That is the problem Burn-O-Meter is designed to solve.
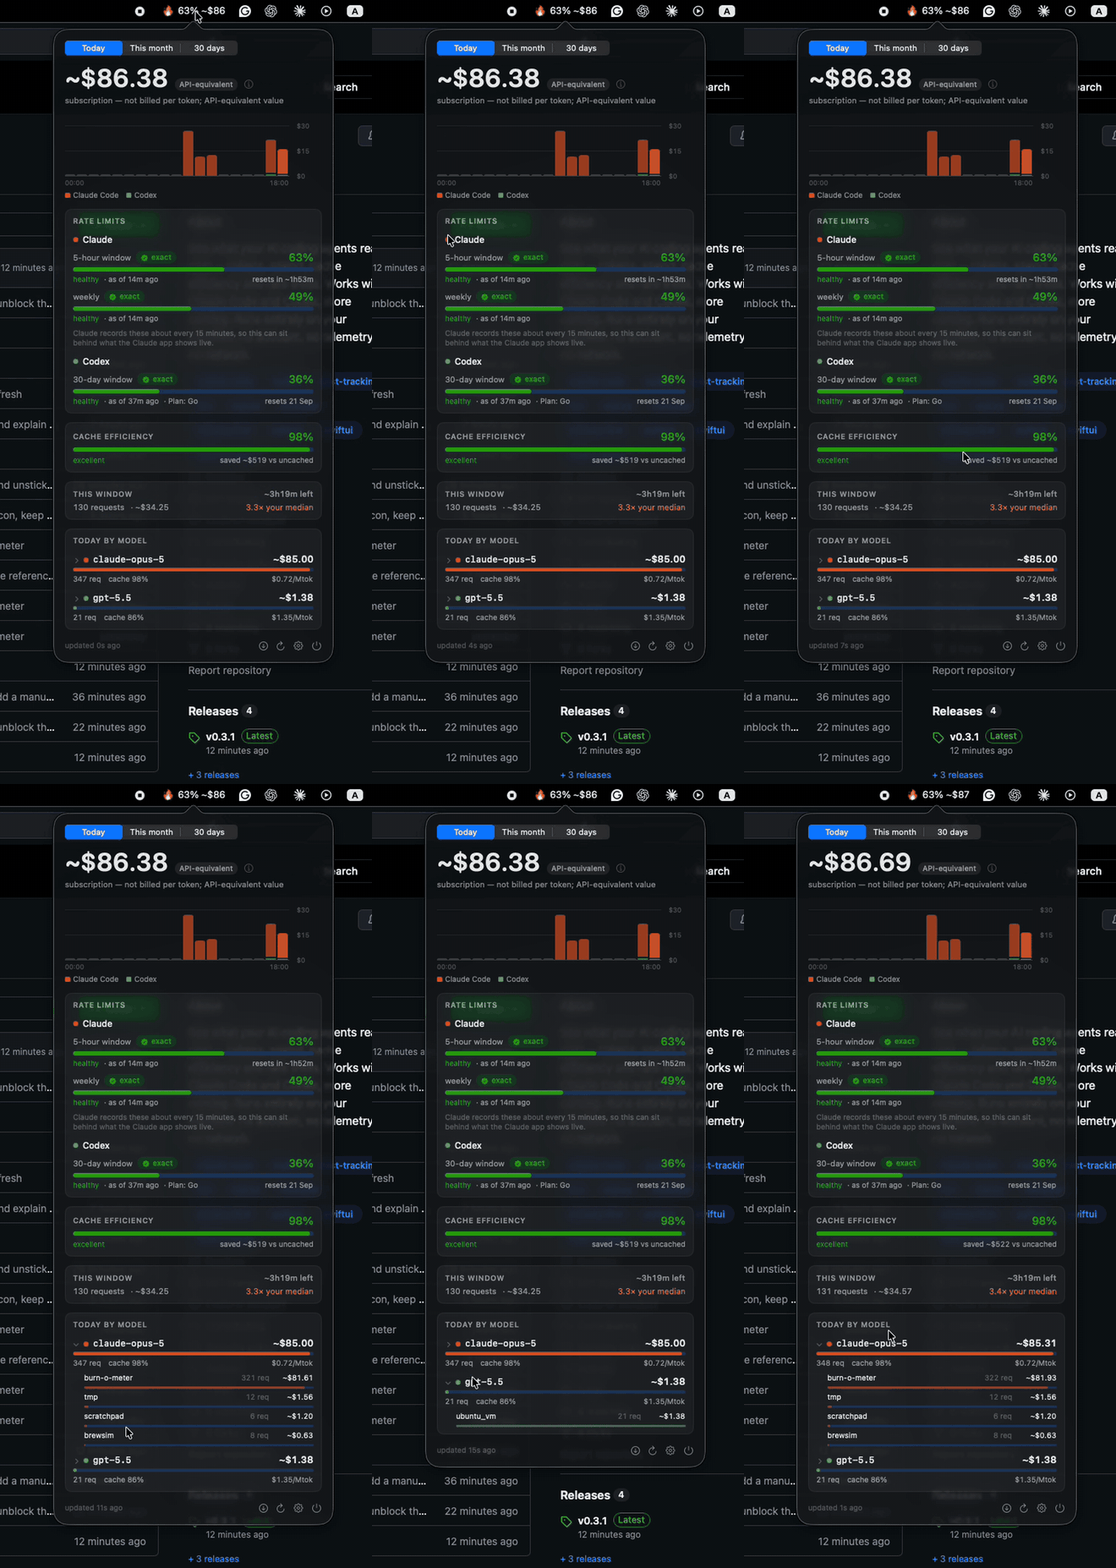
What Is Burn-O-Meter?
Burn-O-Meter is a local usage and cost tracking tool for AI coding agents. It reads the usage information that supported agents already store on your machine and turns it into a single view of token usage, estimated cost, cache efficiency, projects, models, and available rate-limit information.
The idea is fairly simple:
AI coding agents → Local usage data → Burn-O-Meter → One usage view
It does not sit between you and the model provider, and it does not need to proxy your requests through another service. Instead, it reads the data that the agents have already written locally.
That makes it useful when you are working with multiple coding agents and want one place to understand what is happening.
Why Do You Need Another Usage Tracker?
The problem becomes obvious once you start using multiple AI coding tools.
You might use Claude Code for one project and Codex for another. Each tool has its own way of reporting usage, and each provider sees only its own activity.
So you can answer:
"How much did I use Claude Code?"
and
"How much did I use Codex?"
But answering:
"How much am I using across all my AI coding agents?"
is much harder.
Burn-O-Meter brings those sources into a common local ledger so you can look at them together. It also looks beyond the model itself because the coding tool matters. Two different tools using the same model can behave differently depending on how they handle context and caching.
That makes the tool useful for more than simply counting tokens.
What Does Burn-O-Meter Track?
Token Usage
The first thing you probably want to know is how many tokens your coding agents are consuming.
Burn-O-Meter collects the token information available from the supported agents and lets you look at it by model, day, project, or usage window.
For example:
burn-o-meter today
gives you a current view of today's usage.
You can also look at model-level usage:
burn-o-meter models --since 30d
This gives you information such as requests, token usage, cost basis, cache-hit rate, and effective cost per million tokens.
Cost and API-Equivalent Value
This is one area where Burn-O-Meter takes a more careful approach than simply putting a dollar sign beside every number.
Not every AI coding agent is billed per token.
For example, subscription plans can provide a certain amount of usage without charging you directly for every individual token. In those cases, Burn-O-Meter labels the number as API-equivalent rather than pretending that the amount is an actual bill.
That distinction matters.
If the tool says:
~$69.06
The ~ indicates that the value is an estimate based on API-equivalent pricing rather than a statement that you were actually charged $69.06.
If a provider reports an exact value, the tool can identify that separately. If there is no known price for a model, it does not simply report $0.00.
Cache Efficiency Matters More Than You Think
Looking only at the advertised model price can be misleading when you are using coding agents.
An agent can repeatedly send context to a model, while caching can change how much of that input is effectively processed at the normal input rate.
That is why Burn-O-Meter reports cache-hit percentage and effective $/Mtok alongside model usage.
For example, a model may have a relatively high list price, but if a large percentage of the context is being served from cache, the effective rate can look very different.
This is especially useful when comparing how different coding agents use the same underlying model.
Rate Limits Are Part of the Picture Too
Cost is not the only thing you need to monitor.
AI providers can impose usage limits and rolling windows, and hitting those limits can become a practical problem when you are working heavily with coding agents.
Burn-O-Meter exposes the rate-limit information available from supported providers and can show usage windows and reset information where the underlying data supports it. For example, the blocks command shows rolling five-hour usage windows and compares them with your historical usage.
burn-o-meter blocks
This is useful because a sudden increase in usage is easier to spot before it becomes a "why did the agent stop working?" problem.
One CLI, Multiple Views
Burn-O-Meter provides several commands depending on what you are trying to understand.
burn-o-meter today
Shows today's usage, current usage windows, and available rate-limit information.
burn-o-meter models --since 30d
Shows usage grouped by model, including cache efficiency and effective cost.
burn-o-meter daily --since 14d
Shows how usage has changed from day to day.
burn-o-meter projects
Shows usage by project.
burn-o-meter blocks
Shows rolling usage windows.
burn-o-meter doctor
Shows what the tool detected, where the data came from, and how pricing information was obtained.
There is also JSON output, which makes the information easier to consume from scripts or other tooling:
burn-o-meter today --json
That opens the door to doing more with the data instead of keeping it inside the CLI.
CLI or macOS Menu Bar?
Burn-O-Meter comes with both a command-line interface and a macOS menu-bar application.
The CLI is useful when you want to query usage from a terminal, automate reports, or pipe JSON into another tool.
The menu-bar application is designed for the opposite situation: you just want to glance at your current usage without opening another terminal.
The two interfaces use the same underlying numbers. The menu bar gives you a quick view, while the CLI provides more detailed reports.
The current release is tested on macOS 14 and later. The CLI is designed to be portable, although Windows and Linux are not currently verified by the project. The repository currently describes the project as alpha v0.6.0.
Supported AI Coding Agents
The current implementation supports:
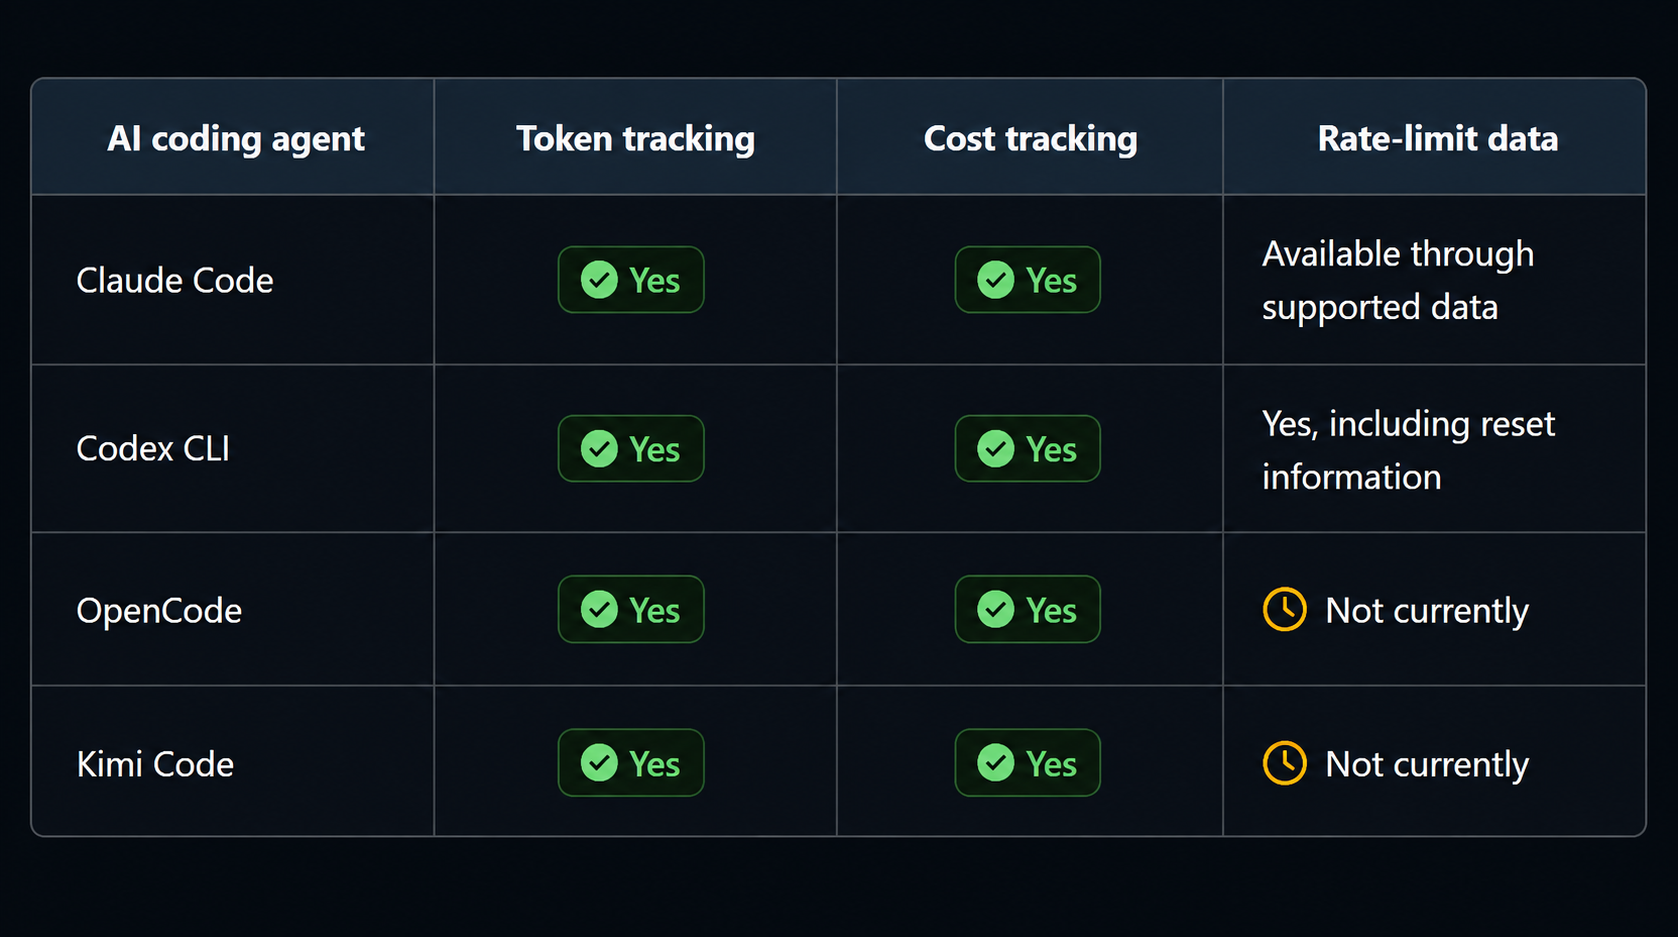
Burn-O-Meter can also read Claude plan-usage information separately on macOS. The project is continuing to add integrations, with additional agents listed on its roadmap.
One interesting detail is that OpenCode can work with different providers, meaning the same adapter can cover models from providers such as DeepSeek, Kimi, GLM, Qwen and MiniMax when they are used through OpenCode.
How to Install Burn-O-Meter
The project deliberately does not use a curl | sh installation command.
Instead, you clone the repository first, inspect the code if you want to, and then run the installer:
git clone https://github.com/devopsinside/burn-o-meter
cd burn-o-meter && ./install.sh
The installer can set up the CLI, menu-bar application, background scanning, and login item on supported macOS systems.
If you only need the CLI, the project also supports installation through Homebrew, pipx, or uv. The CLI requires Python 3.11 or newer and is not currently published on PyPI.
Once installed, you can start by scanning the existing agent data:
burn-o-meter scan
Then check today's usage:
burn-o-meter today
The first scan reads the logs already stored by your supported coding agents.
What About Privacy?
This is probably one of the first questions anyone should ask when a tool is reading AI-agent logs.
Those logs can contain information about your development work, so simply saying "it's local" isn't enough.
Burn-O-Meter's approach is to extract specific numeric and metadata fields rather than reading the actual prompt and completion content. The project also says credentials are not opened and that the tool has no telemetry, analytics, crash reporting, or background network communication.
There is no account or central server required.
Network requests are limited to actions the user explicitly initiates, such as refreshing pricing information or checking for updates. The project also provides:
burn-o-meter doctor --security
to inspect its security checks.
For a usage tracker that works with AI development data, keeping the data local is an important design decision rather than just a convenience.
Why This Matters
AI coding agents are changing the way developers work, but the observability around them is still catching up.
We already have tools for watching CPU usage, memory, network traffic, application latency, cloud spending, and Kubernetes workloads. AI coding agents introduce another set of numbers that can become useful operational signals:
tokens, cache efficiency, model usage, rate limits, and effective cost.
Burn-O-Meter puts those numbers in one place without requiring another account or another hosted monitoring platform.
And that is probably the most useful way to think about it.
It is not trying to replace your AI coding agents. It is simply giving you a meter for what they are doing.
Final Thoughts
AI coding agents can make developers dramatically faster, but once you start using several of them regularly, usage can become difficult to understand.
Which model are you using the most? Which project is consuming the most tokens? How efficient is your caching? Are you approaching a usage limit? And when a number shows up as a cost, is it an actual bill or an API-equivalent estimate?
Those questions are much easier to answer when the data is brought together.
Burn-O-Meter takes the usage data already sitting on your machine and turns it into something you can actually understand.
"Sometimes you don't need another dashboard.
You just need to know what the fire is burning."🔥