AI Agent Performance Testing for DevOps: Load, Latency, and Token Monitoring
Master AI agent performance testing with this complete SRE guide. Learn how to load-test multi-turn sessions, track TTFT and latency percentiles, monitor token burn rates, and integrate GenAI observability into CI/CD to prevent 3 AM budget surprises.
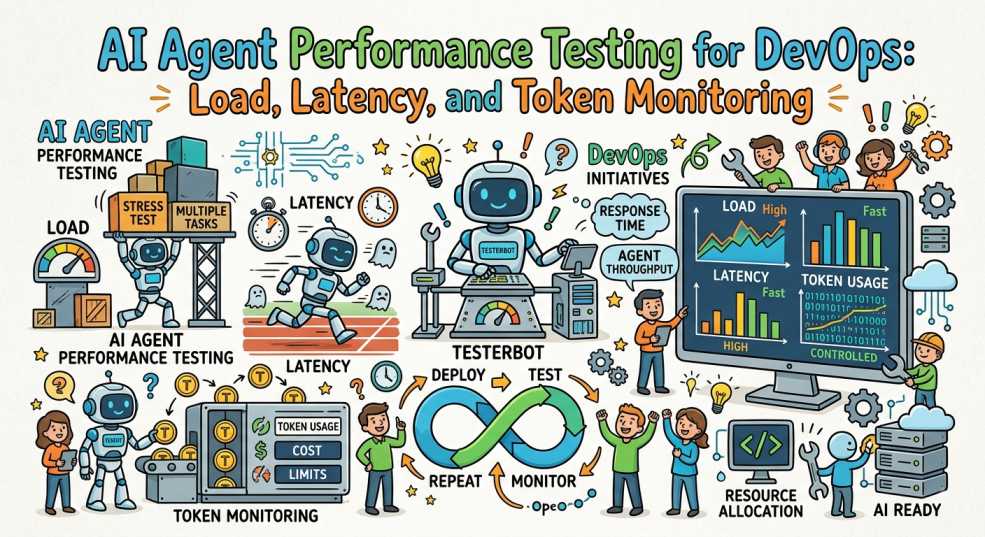
Welcome to DevOps Inside, where we break things so you can scale them safely (and smile while doing it). Today we're diving into a new beast in the SRE zoo: AI agents. These aren't just simple APIs anymore. They're stateful assistants, multi-step pipelines, and token-burning machines that can surprise your budget and your SLA at 3 AM. This guide walks through how to load test them, measure latency, and keep a sharp eye on token consumption so your platform doesn't turn into a money bonfire. 🔥
Why AI Agent Performance Testing Is Different (and more fun)
Traditional services are about requests, CPU, memory, and network. AI agents add a few spicy dimensions:
- Tokens = Currency: Each call consumes input and output tokens. Monitoring tokens is just as critical as monitoring latency or memory.
- Statefulness: Agents maintain conversation histories and context windows. Load testing must simulate realistic, multi-turn sessions, not just stateless HTTP calls.
- Tool Calling & MCP Workflows: Agents don't just generate text. They query databases, call APIs, and execute tools through mechanisms such as Model Context Protocol (MCP). Every additional tool call introduces another potential source of latency, failure, retries, and resource consumption. MCP's current 2026-07-28 specification provides a standardized way for AI applications to connect with external tools and systems.
- Prompt Caching Dynamics: Some LLM providers support caching portions of prompt context. A cache hit versus a cache miss can change both latency and cost.
- Variable Compute: Different prompts, model sizes, guardrails, or streaming configurations can drastically alter CPU/GPU utilization and latency.
- Rate Limits & Quotas: Third-party provider limits, such as tokens per minute and requests per minute, can throttle your load tests and your production users if not carefully managed.
Short story: A midnight surprise
Picture this: you launch a new agent feature, and your monitoring alarms are asleep. Within hours, token consumption spikes and cost balloons. The agent is slower because contexts grew too large and tool calls hit retries. Your users are frustrated.
The fix? A testing strategy that includes token monitoring, prompt caching visibility, and realistic load scenarios. Avoid the midnight chaos 👀.
Core Metrics You Must Track
When testing AI agents, instrument everything. The essential metrics are:
- Latency (End-to-End & Granular):
- TTFT (Time To First Token): Critical for streaming UX. How long before the user sees the first token?
- TPOT (Time Per Output Token): How quickly is the model generating response tokens after generation begins?
- Tool Execution Latency: Time spent inside external tool calls, APIs, vector databases, or MCP tools.
- p50, p95, p99: Track these for entire agent responses and individual pipeline stages such as prompt preparation, guardrails, model calls, and post-processing.
- Throughput: Requests per second (RPS) and completed multi-turn sessions per minute.
- Error Rate: Failed HTTP responses, model timeouts, tool execution failures, and infinite agent loops.
- Tokens Per Request: Input tokens, output tokens, and cached tokens where the provider exposes them.
- Tokens Per Second / Minute: Token burn rate, which is vital for cost forecasting and provider quota monitoring.
- Cost Per Transaction: Approximate currency cost based on actual token usage, cache behavior, and model pricing.
- Resource Utilization: CPU, memory, GPU usage, and network egress for self-hosted or proxy infrastructure.
- Session Length: Number of turns per conversation, which directly impacts context growth and token accumulation.
Designing Effective Load Tests
Load testing AI agents is less about blasting max RPS and more about realistic, multi-dimensional scenarios.
1. Build realistic user journeys
Simulate conversation sessions with varying lengths. Include short queries with 1–2 turns as well as long sessions with 20+ turns. Include tool-heavy user journeys where agents call multiple backend APIs.
2. Ramp and soak, not just spike
Start with a warm-up under realistic traffic conditions and allow caches and model worker pools to reach normal operating conditions where applicable. Ramp to target load over minutes, then soak for hours to catch memory leaks, context bloat, and runaway agent execution loops.
3. Vary model complexity, payloads, and tool execution
Mix lightweight prompts with heavy prompts containing large amounts of context or RAG retrievals. Test different models, guardrail configurations, and streaming versus non-streaming responses.
4. Respect provider limits
Apply client-side rate limiting to avoid being blocked during tests. Coordinate load tests with the provider if you expect heavy token throughput.
Token Monitoring: The Secret Sauce
Tokens = cost + performance vector. Tracking them is non-negotiable.
What to measure
- Input Tokens: Prompt and retrieved context size.
- Output Tokens: Response length, especially when streaming.
- Cached Tokens: Input tokens served from provider-managed caches where supported.
- Reasoning Tokens: Where a model or provider exposes separate reasoning-token usage.
- Total Tokens Per Session: Cumulative token usage across conversation turns.
- Token Burn Rate: Tokens/sec and tokens/min, which helps predict spend and track rate limits.
- Token Budget Remaining: For per-user, per-team, or per-organization quotas.
How to collect token metrics
- Instrument the agent service using OpenTelemetry GenAI Semantic Conventions to standardize GenAI telemetry across providers.
- Log token counts and cache information at each model-call stage where the provider exposes them.
- Summarize tokens per session and persist them to a time-series database such as Prometheus, InfluxDB, or Datadog.
- Expose derived metrics such as tokens/sec, cache hit ratio, tokens/session, and cost/hour.
OpenTelemetry's GenAI observability work covers model calls, token usage, and tool calls. The GenAI semantic conventions have also moved into a dedicated repository and continue to evolve, so implementations should follow the current conventions rather than relying on older attribute names.
Testing Scenarios for Token Behavior
Design tests that reveal token pitfalls:
- Context Growth Test: Simulate 20+ turn conversations to observe how context accumulation affects latency, TTFT, and token burn.
- Failure Retry & Loop Test: Trigger error states or ambiguous queries to catch infinite tool loops and unexpected token burn before they hit production.
- Prompt Caching Efficiency Test: Evaluate cache hit rates on system prompts and static context to quantify cost and latency improvements.
- Burst vs. Sustained Test: Short bursts test rate-limit resilience, while sustained loads test long-term budget caps and model concurrency.
- Prompts & Guardrails A/B Test: Compare token efficiency and latency overhead when adding inline guardrails or switching between few-shot and zero-shot prompts.
Observability & Dashboards
Make a clean dashboard so you can proudly point at it during incident calls 📈. Key panels:
- Latency Histograms (p50/p95/p99): Broken down by TTFT, TPOT, tool execution time, and endpoint/model.
- Tokens & Cache Performance: Input, output, cached, and reasoning tokens consumed, along with cache hit ratios where available.
- Cost Projection: Convert active token burn rates into real-time monetary units.
- Error & Loop Rate: Failures categorized by type, such as model errors, tool timeouts, rate limits, and infinite loops, with links to distributed traces.
- Resource Usage: Infrastructure CPU/GPU versus active model invocations.
Alerting rules
- High TTFT / p99 Latency: Latency exceeds the target for 5+ minutes.
- Unusual Token Burn Rate: Token burn rate exceeds the forecasted budget threshold.
- Tool / Model Error Spike: Error rate exceeds the agreed threshold.
- Low Cache Hit Ratio: Cache hit rate drops unexpectedly, causing latency or cost increases.
- Provider Quota Warning: Nearing provider limits, such as 80% of the tokens-per-minute quota.
Scaling Strategies & Cost Control
When tests reveal performance bottlenecks or budget breaches, apply these optimization patterns:
- Autoscaling: Scale agent worker nodes based on request queue depth, active session count, and CPU/GPU metrics.
- Prompt Caching: Structure prompts and reusable context to maximize cache reuse where the provider supports it.
- Context Window Management: Trim earlier turns, use sliding windows, or summarize past turns to keep token counts bounded.
- Dynamic Model Routing: Route lightweight queries to smaller, faster models and save more expensive models for complex reasoning tasks.
- Tool Call Optimization: Parallelize independent tool executions and enforce strict timeouts on tool invocations.
- Rate Limiting & Quotas: Implement per-user or per-tier rate limits and graceful degradation to prevent runaway spend.
Integrating Tests into CI/CD
Automate your performance checks so regressions are caught long before production deployment:
- CI Smoke Tests: Run lightweight automated tests verifying token-per-request baselines and TTFT on every pull request.
- Nightly / Weekly Soak Tests: Schedule automated multi-turn load tests in staging environments to evaluate long-term context stability and memory usage.
- Deployment Gates: Block production releases if token consumption increases beyond an agreed threshold or p95 TTFT regresses beyond acceptable limits.
Tip: Use Feature Flags
Roll out agent updates behind feature flags and leverage canary deployments to validate real-world token usage and latency metrics under a fraction of live traffic.
Tools & Tech Stack Suggestions
Pick tools you already love and sprinkle in agent-aware observability components:
- Load Testing Tools: k6, Locust, or custom async harnesses configured for multi-turn sessions, tool mocks, and streaming responses.
- Metrics & Tracing: OpenTelemetry with GenAI semantic conventions, plus Prometheus, Grafana, or Datadog for tracing and metrics across model calls and tool execution.
- Agent Observability & Evals: Arize Phoenix, LangSmith, or OpenInference for agent debugging, trace visualization, and tool execution inspection.
- Storage & Context Caching: Redis or Valkey for high-speed session state management.
- Cost Engine: Custom Grafana formulas or APM integrations that map token metrics to provider pricing.
Sample Acceptance Criteria for a Release
Make a quick checklist your engineering team can review before shipping to production:
- Average Tokens per Session: Remains within the expected budget range.
- Time To First Token (TTFT): p95 TTFT stays within the agreed target.
- End-to-End Latency: p95 latency stays within the agreed target for the model and workload.
- Error Rate: Remains below the agreed threshold under steady-state load.
- Context Bloat Protection: No continuous rise in tokens per turn during soak tests.
- Cost Boundary: Projected cost burn rate does not exceed allocated budget caps.
Final Checklist: Quick Wins to Implement Today
- Instrument input, output, cached, and reasoning token usage where available using OpenTelemetry.
- Build a dashboard tracking TTFT, TPOT, p95 latency, tool execution time, and tokens/sec.
- Add client-side rate limiting, tool execution timeouts, and per-user quotas.
- Run multi-turn load tests using ramp and soak scenarios with tool mocks in your staging environment.
- Implement context trimming or summarization to prevent unnecessary token growth in long conversations.
Wrapping Up: Keep Calm and Count Tokens
AI agents add incredible capabilities to your product, but they also introduce new vectors for performance degradation and unexpected costs. Treat tokens and tool executions as first-class telemetry. Test with realistic multi-turn sessions, monitor TTFT alongside traditional latency percentiles, and automate performance gates in your CI/CD pipelines.
With a solid load testing and observability strategy, you'll dodge the 3 AM budget surprise and deliver reliable, lightning-fast agent experiences. 🚀
Want more hands-on guides and templates for agent load testing? Swing by DevOps Inside. We love nerding out about observability, automation, and making SRE life a little less chaotic (and a lot more fun)!