AI Workloads Expose Hidden DevOps Crisis in Scalability and SRE
AI workloads are breaking traditional DevOps playbooks. Discover how GPU scaling, cold starts, and model health are exposing a hidden SRE crisis.
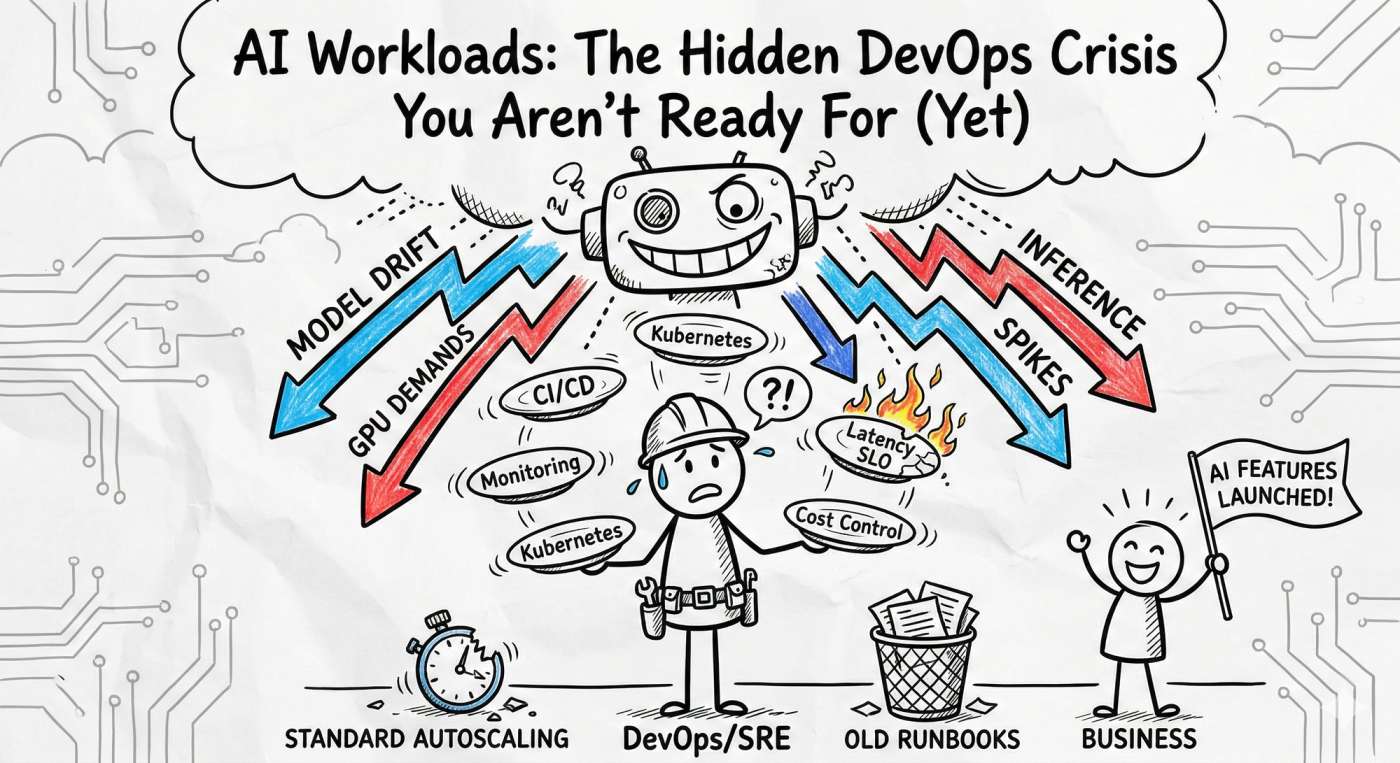
Picture this: Your product team launches a groundbreaking AI feature at 11:00 AM. By 11:07 AM, latency is through the roof, cost alerts are screaming, and your SRE team is sprinting like it’s a site-wide outage. 🚨
Welcome to the chaotic intersection where AI workloads meet traditional DevOps. In 2026, we’ve realized that the old playbook doesn't just need an update, it needs a total rewrite.
Why AI is a Different Beast
AI workloads aren't just "big apps." They are unpredictable, hardware-hungry, and stateful monsters. Here is why your standard Kubernetes setup might be struggling:
- Hardware Drama: You aren't just managing CPUs anymore. GPUs and TPUs have entirely different scheduling rules, costs, and failure modes.
- The "Cold Start" Killer: Unlike a tiny Go microservice, AI models are massive. Loading them into GPU memory takes time. If you don't have "warm pools," your latency SLOs are dead on arrival.
- Cost Volatility: Running a cluster of H100s 24/7 without aggressive, smart scaling is a one-way ticket to a budget meltdown. 💸
- Model Drift: The infra might be "green," but if the model starts giving "hallucinated" or stale results, the system is technically down. Traditional APM won't catch that.
The "Real-World" Oof: > Imagine a recommendation engine that uses batching to save costs. During a flash sale, the batches wait too long to fill up. Latency balloons, customers see empty "Suggested for You" boxes, and your conversion rate craters. The rollback is messy because you didn't just have a code bug; you had a concurrency and tail-latency crisis.
3 Strategies to Tame the AI Chaos
1. Stop Scaling on CPU Alone
If your HPA (Horizontal Pod Autoscaler) is still looking at CPU percentages, you’re flying blind. AI workloads are often GPU-bound or memory-bound.
- Action: Autoscale based on Queue Length or GPU Utilization.
- Pro-Tip: Use KEDA (Kubernetes Event-driven Autoscaling) to scale your inference pods based on the actual number of requests sitting in your buffer.
2. The "Warm Pool" Pattern
To fight the "Cold Start" problem, maintain a small percentage of "pre-warmed" nodes.
- Example: If you know your traffic spikes at noon, your SRE playbook should include a "Pre-heat" step where you spin up GPU nodes at 11:45 AM. It’s cheaper than a 5-minute outage.
3. Monitor "Health," Not Just "Uptime"
In the AI world, a service can be "Up" (returning 200 OK) but completely broken (returning garbage). You need a three-layered observability stack:
- Infra: GPU memory fragmentation & power draw.
- Performance: p99 latency & cold start frequency.
- Model Health: Feature drift and prediction distribution.
Your AI-SRE Hardening Checklist
Ready to stop the Tuesday morning sprints? Start here:
- Inventory: Map every model to its specific GPU requirement and owner. No more "shadow AI."
- GPU-Aware Autoscaling: Move away from generic metrics.
- AI Runbooks: Create a specific "Model Degradation" playbook. If the data pipeline lags, how does the model fail-over?
- Chaos Engineering: Test what happens when a spot instance is reclaimed mid-inference. Does your load balancer handle it gracefully?
The Tooling Cheat Sheet 🛠️
- Model Serving: NVIDIA Triton or KServe (better batching than a raw Flask app).
- Orchestration: Kubernetes with GPU device plugins.
- Autoscaling: KEDA (essential for event-based scaling).
- Observability: Prometheus + OpenTelemetry (to correlate infra spikes with model drift).
Final Thoughts: Engineering > Hype
AI workloads reveal the cracks in your team boundaries and your tooling. The good news? It’s fixable with pragmatic engineering. Start small: add one model health metric, write one GPU-specific runbook, and stop treating your models like "just another container."
Want to see a sample Grafana dashboard for GPU tracking or a template for an AI-specific SLO? Drop a comment or head over to devopsinside.com. Let’s turn that AI crisis into a well-oiled machine. 🚀